# User Guides

### You've found the user's manual.

### [Get started with the **Portfolio Tracker Pro**](/1/tracker/quick-start)

### [Get started with the **Portfolio Tracker Lite**](/1/smol_tracker/quick-start)

### [Get started with the **Formatter**](/1/formatter/quick-start)


# Portfolio Tracker Pro


# Quick Start

Your download includes 4 files:

* A fresh copy of the template in light theme
* A fresh copy of the template in dark theme
* A demo copy already populated with data
* A setup guide

### Let's get going!

Pick a colour theme and open a fresh copy in Numbers..

### 1.  Set the account type. &#x20;

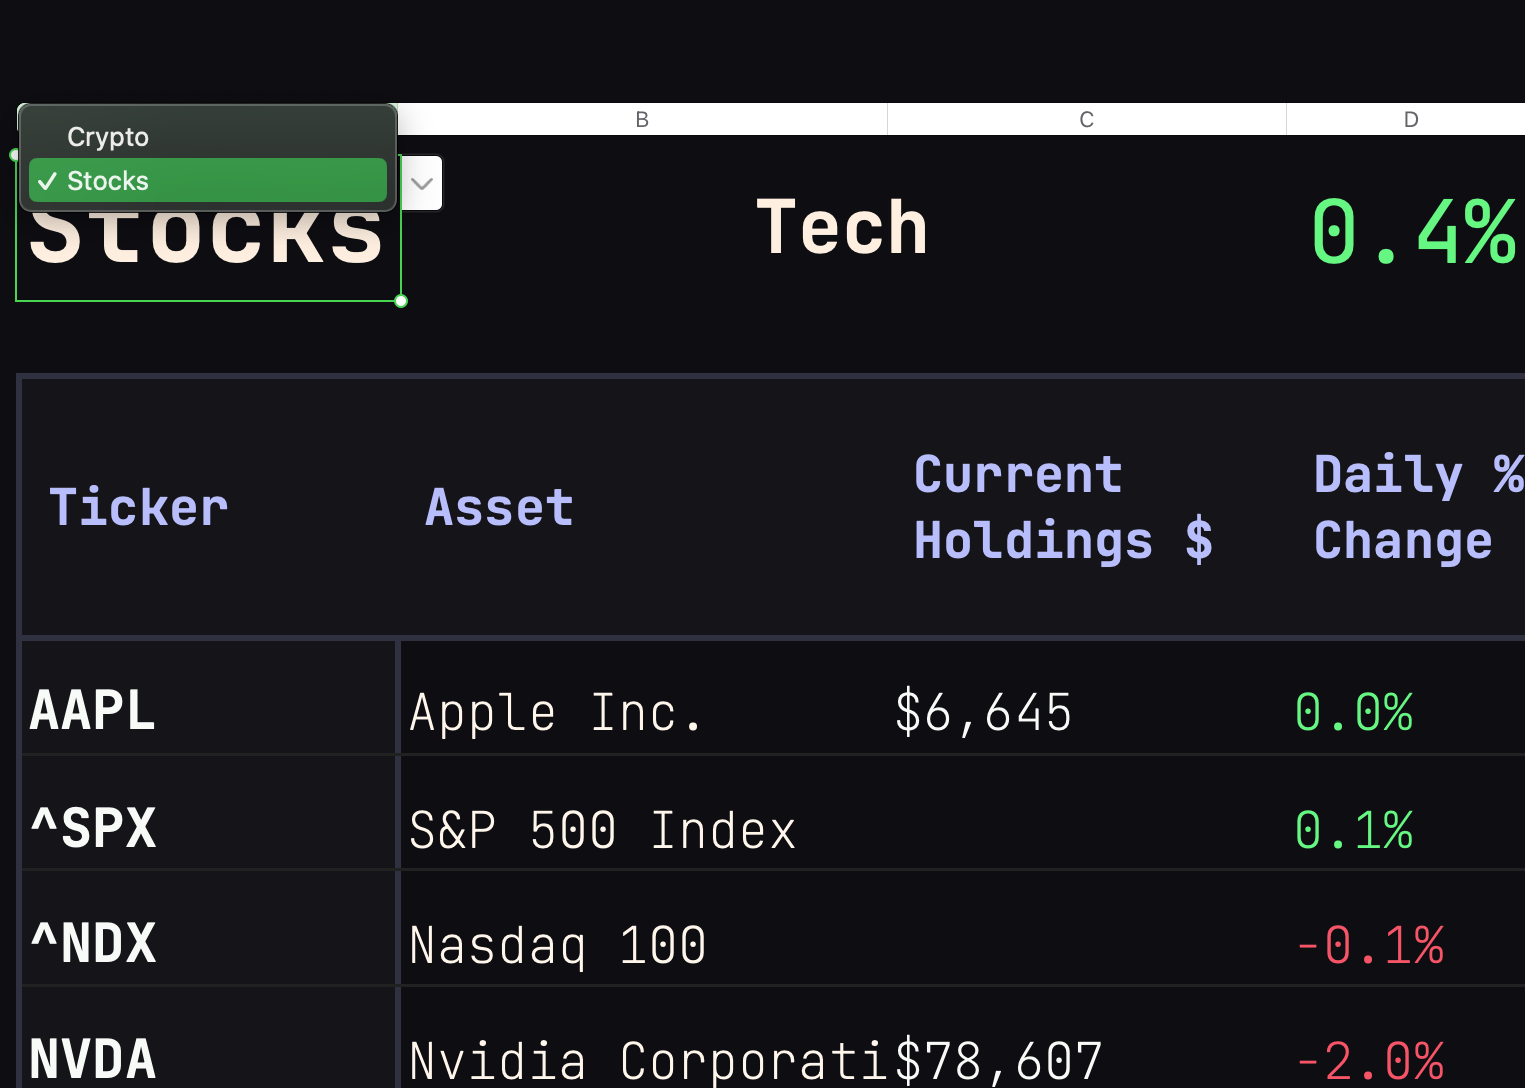
Go to the sheet named "**ACCOUNT 1"** and set the <mark style="color:green;">**Account Type**</mark> in <mark style="color:green;">**B1**</mark> using the pop-up menu **(Crypto** or **Stocks)**. &#x20;

<figure><img src="/files/87SCpuAg5d9YqYWgSj6Z" alt="Portfolio Tracker – Premium Templates for Apple Numbers."><figcaption></figcaption></figure>

### 2. Set your base currency

If you won't be using the US dollar as your primary currency, you can [change the primary currency](/1/tracker/changing-the-primary-currency) now, or you can change it later.&#x20;

<figure><img src="/files/U9LjWDYHP180MSRWcYrz" alt="Portfolio Tracker – Premium Templates for Apple Numbers."><figcaption></figcaption></figure>

### 3. Enter your first trade

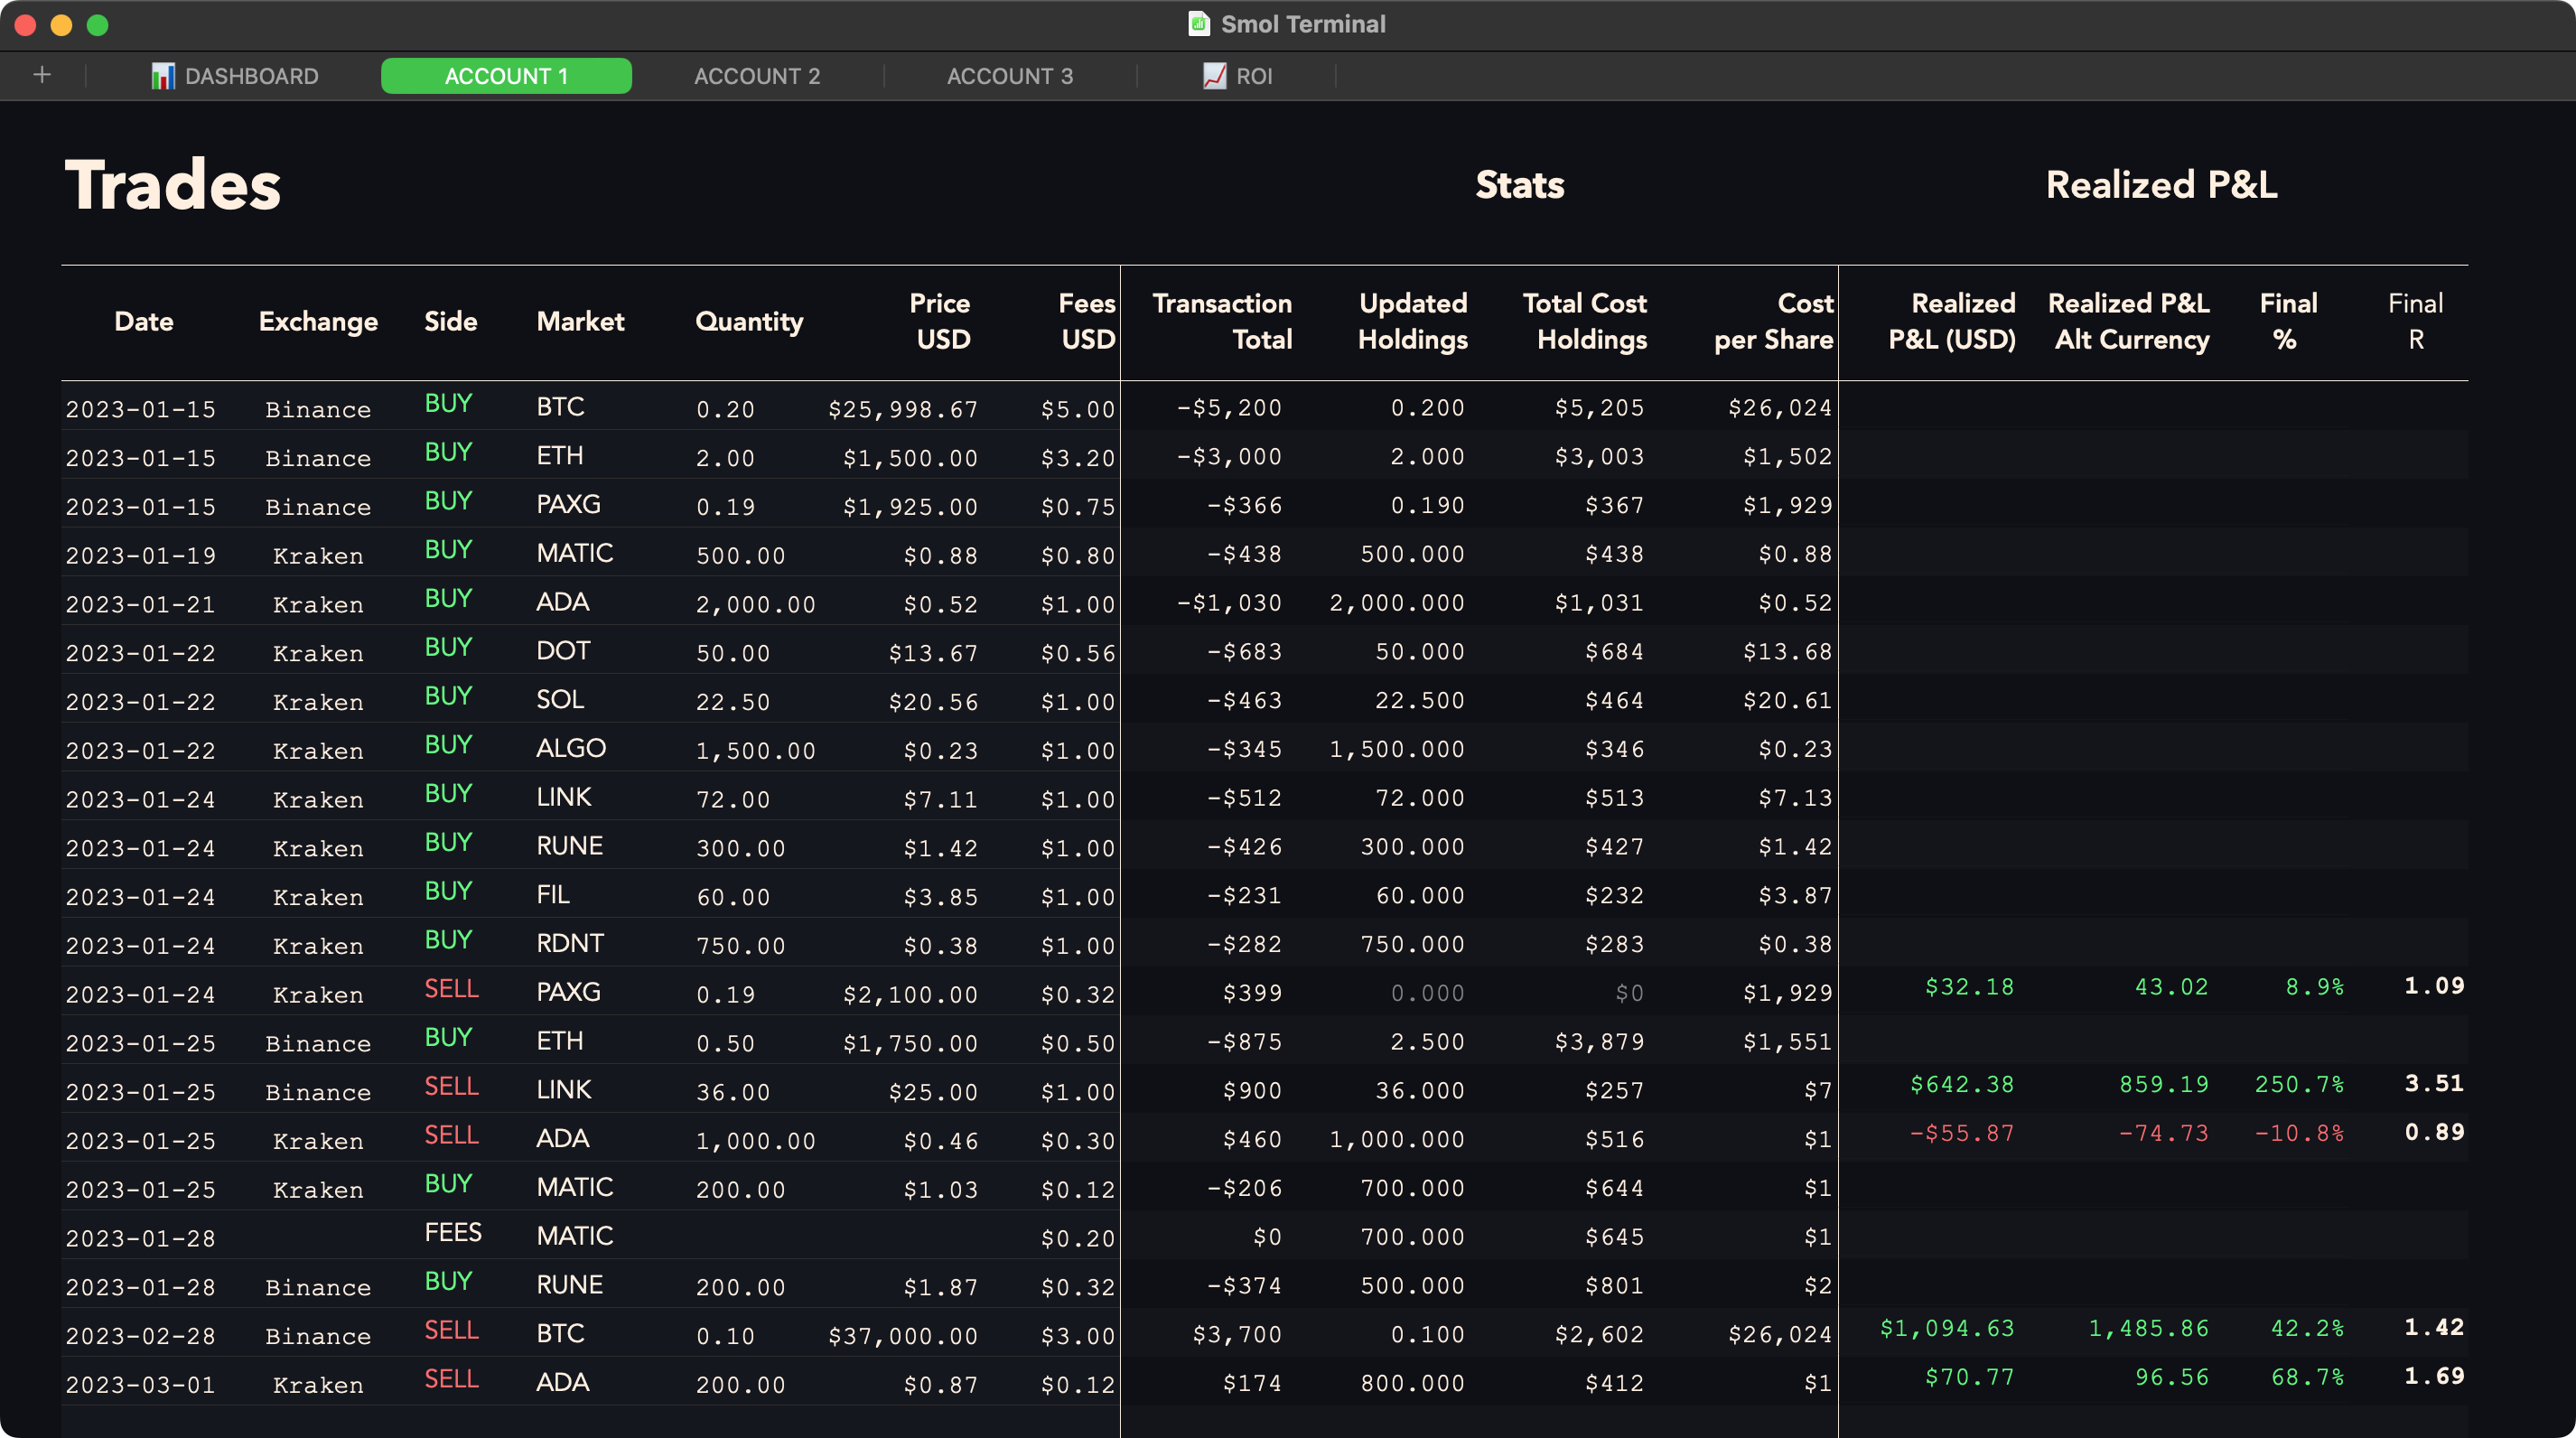
Scroll down to the [**Trade Log**](/1/tracker/accounts#trade-log) and enter your first trade! The first 7 columns (the lighter ones) are where you input your trade details. The "**Account**" and "**Fees**" columns are optional. The columns titled "**Realized P\&L**" only display values when you ***sell*** an asset, so you won't see anything here just yet. &#x20;

<figure><img src="/files/lfuIwXO8SNHBPtKS8cNL" alt="Portfolio Tracker – Premium Templates for Apple Numbers."><figcaption></figcaption></figure>

The [**Holdings**](/1/tracker/accounts#holdings) table has now been automatically updated with live stats for your new asset. This table will automatically update each time you add a trade in your Trade Log.&#x20;

### 4. Take your first snapshot

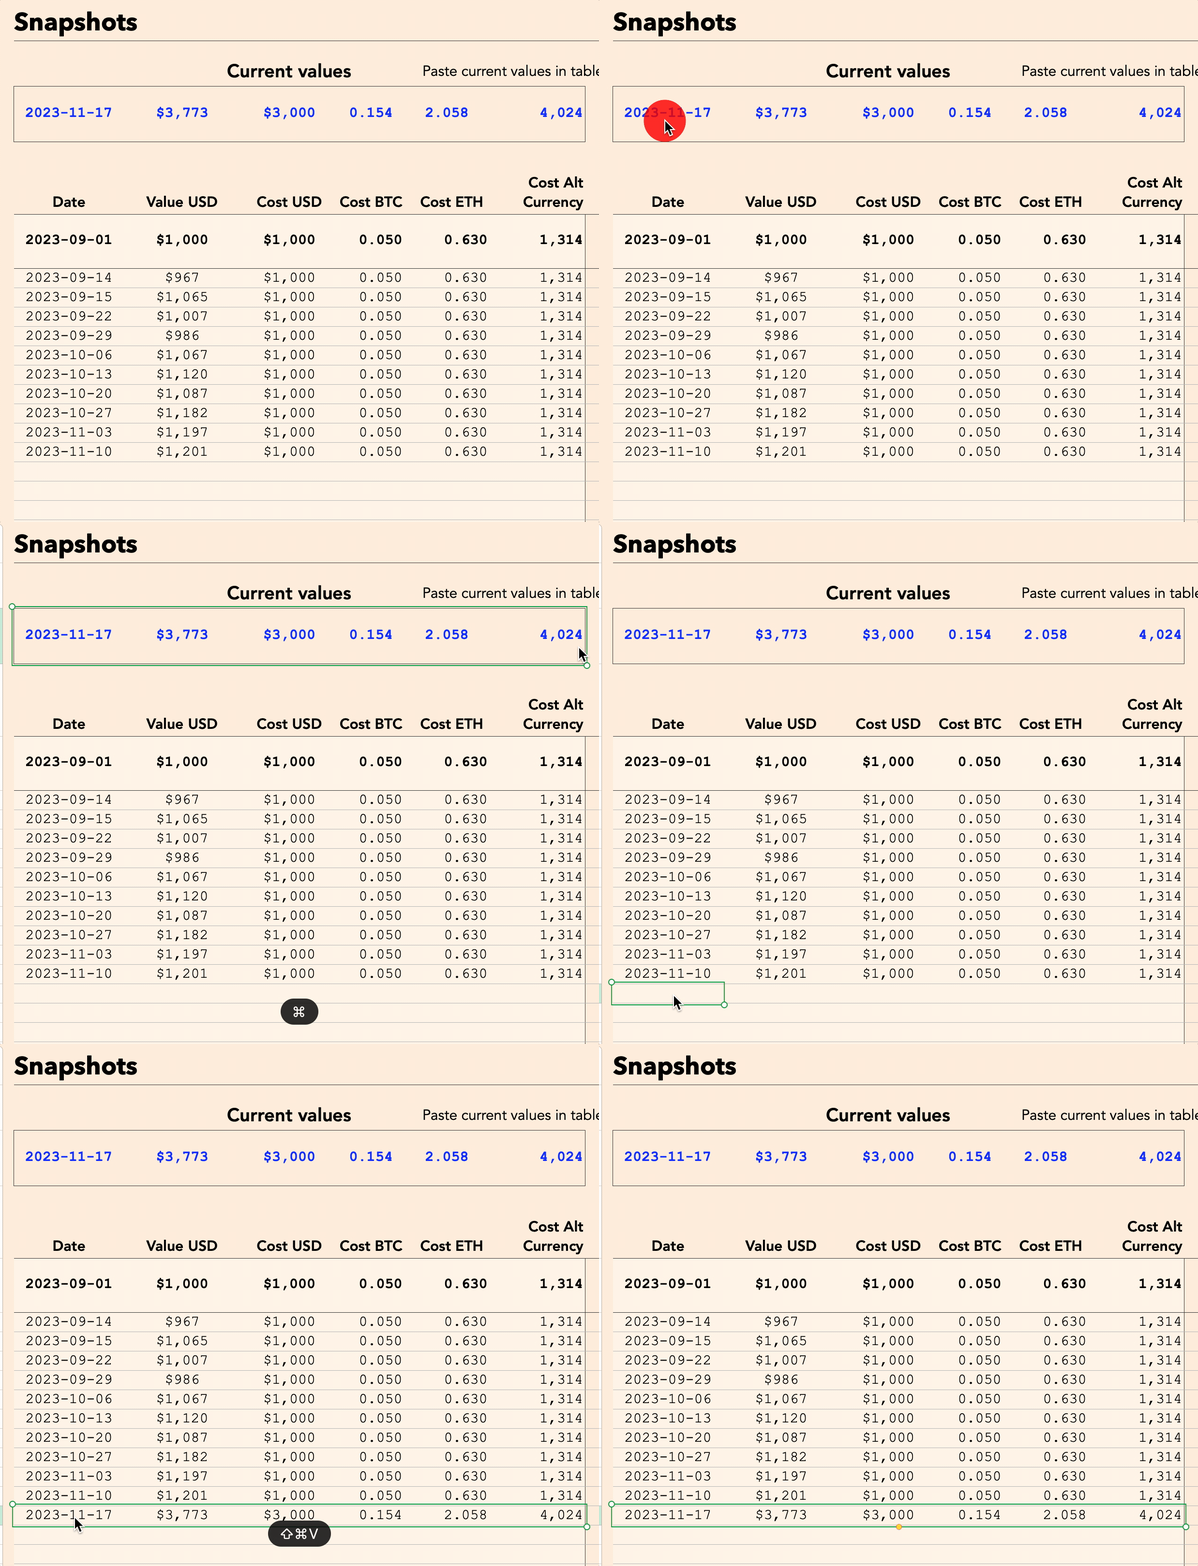
Finally, in the [**Snapshots**](/1/tracker/accounts#snapshots) table (right sidebar), copy the values displayed in blue under **"Current Values"**  and paste them in row 5 (first row with the lighter cells) using **⇧ + ⌘ + V**  (**Edit > Paste Formula Results**).  This sets the initial values of your portfolio and any further snapshots you make will add a new temporal data point in your account's history. These events will populate the [**Account's ROI chart** ](/1/tracker/accounts#accounts-roi-chart)on your account's sheet as well as those on the [**Dashboard Tab**](/1/tracker/dashboard) and the [**ROI Tab**](/1/tracker/roi-tool). <br>

<figure><img src="/files/aYdxv3KG1jxb0ju0e2SH" alt="Portfolio Tracker – Premium Templates for Apple Numbers."><figcaption></figcaption></figure>

### The Dashboard

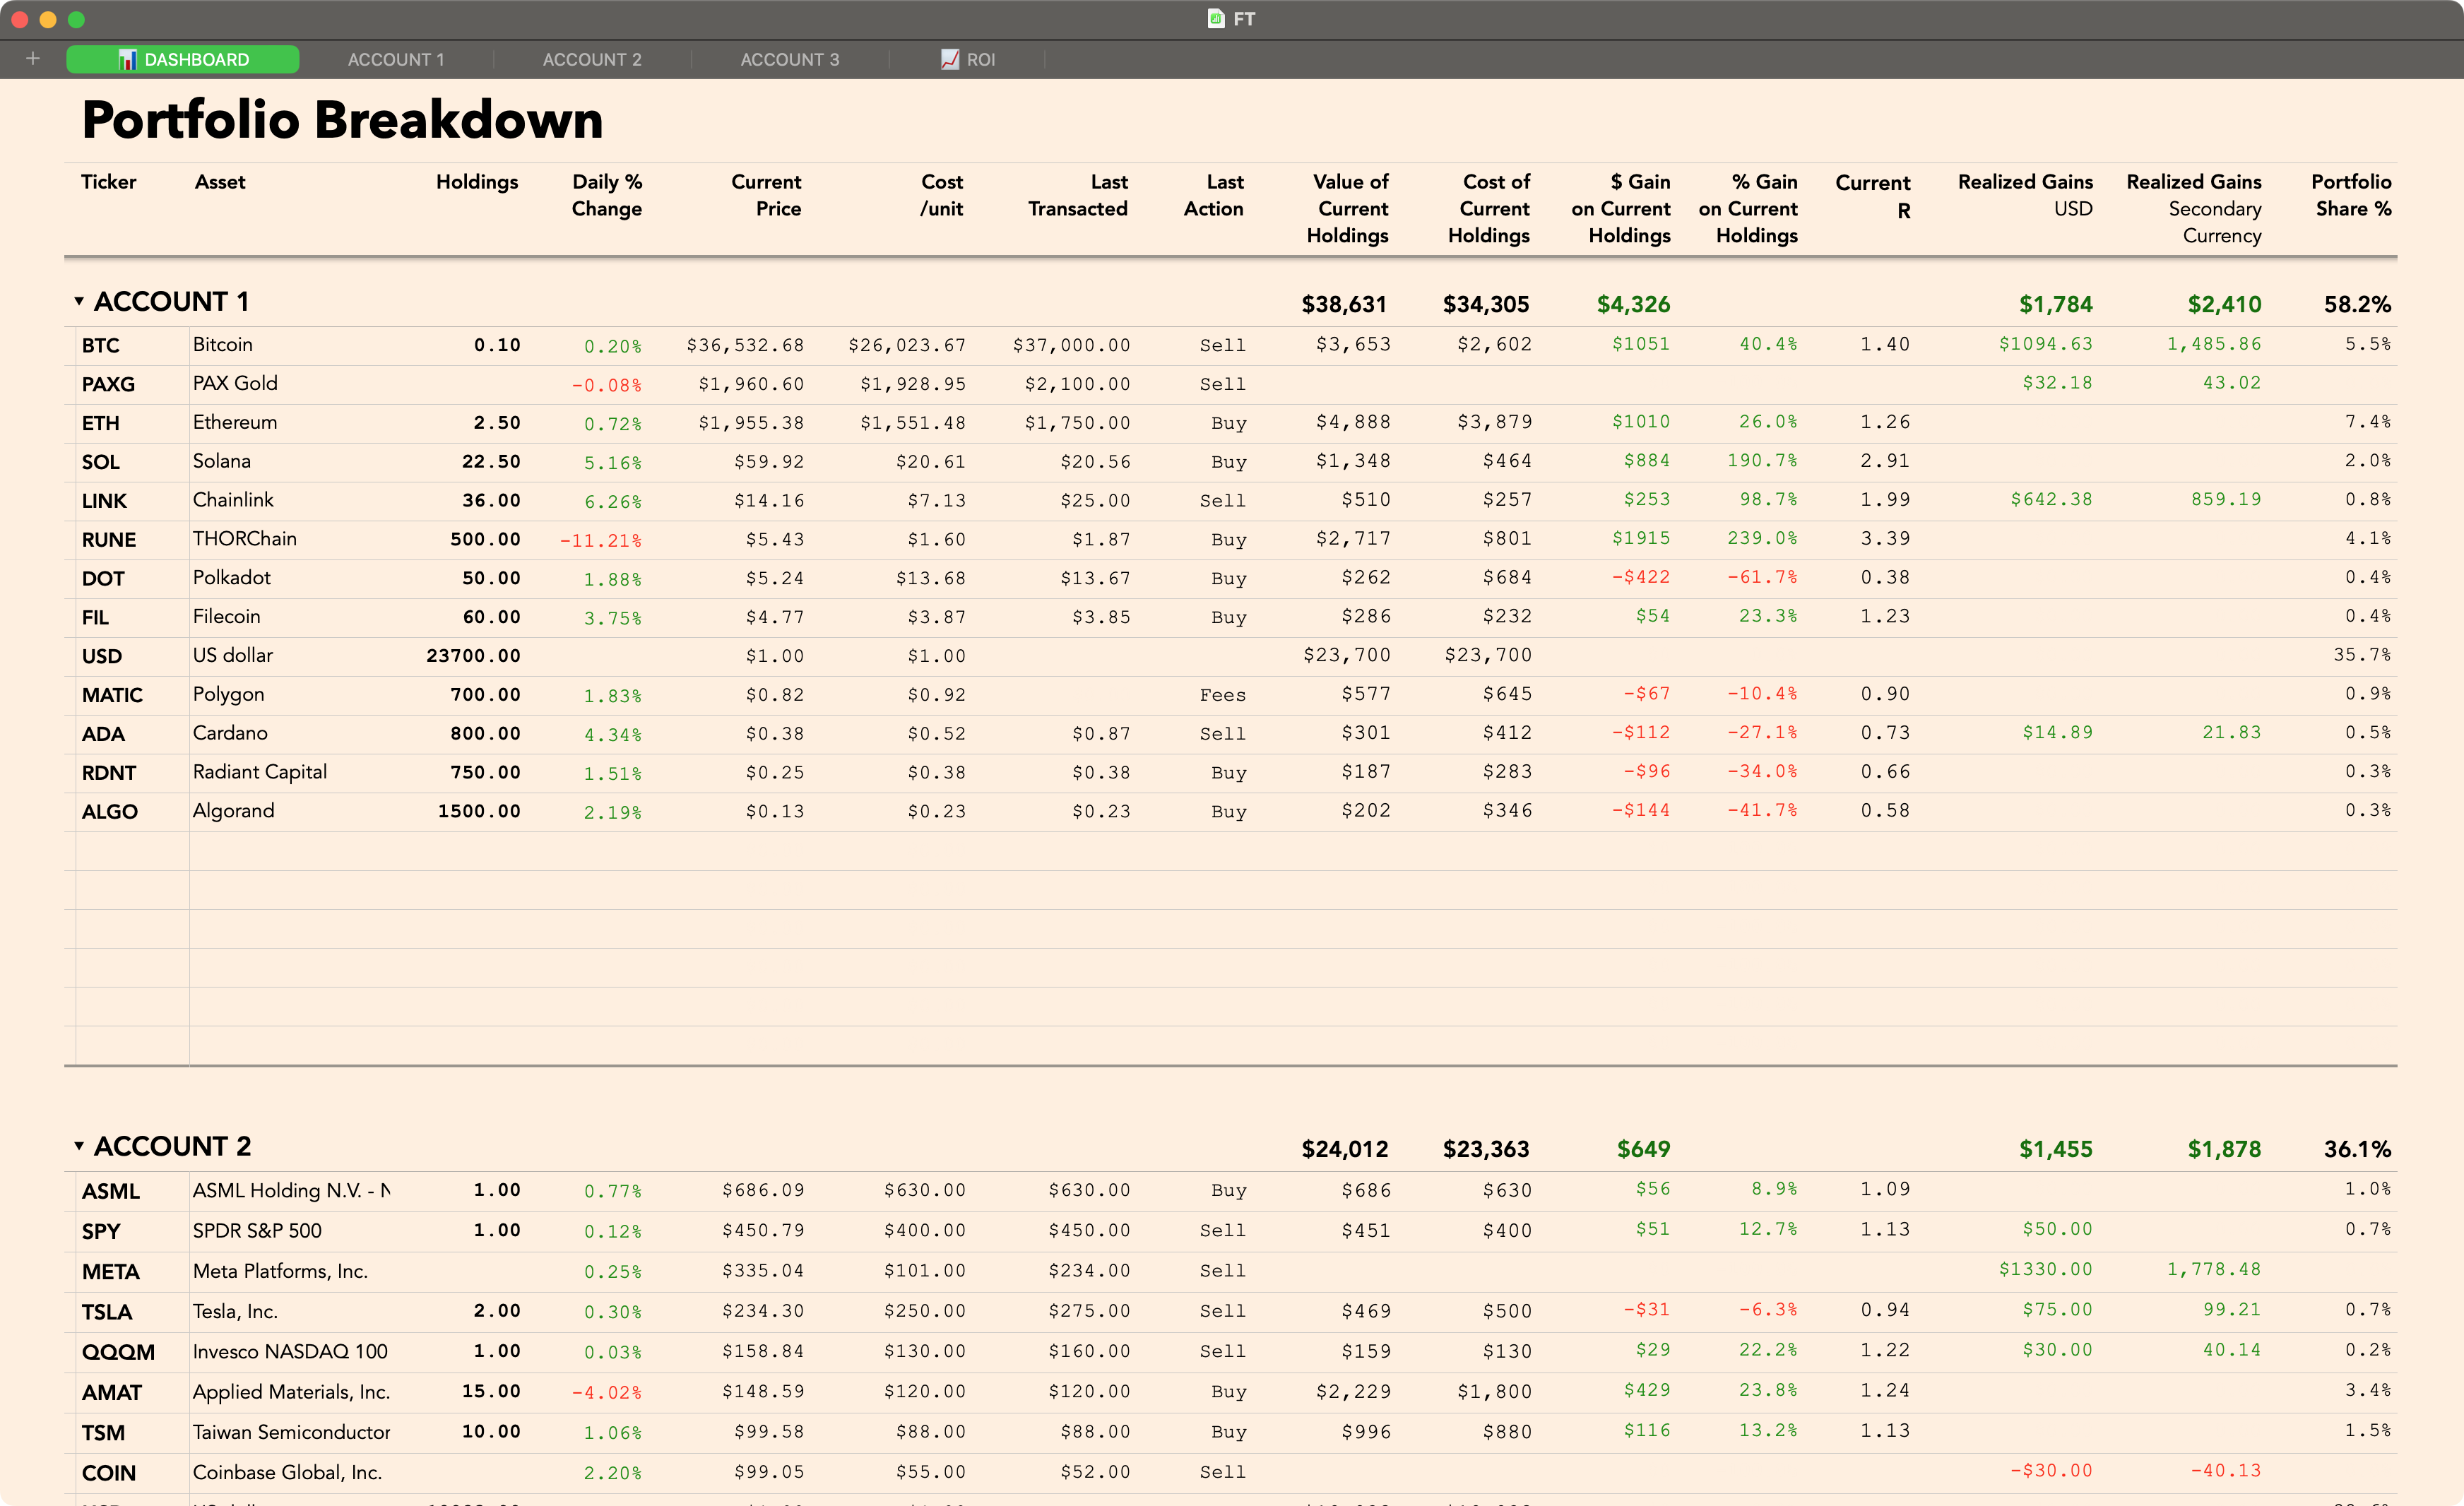
Speaking of the of the [**Dashboard,**](/1/tracker/dashboard) go to that sheet.  You will see 3 distinct accounts listed in the [**Portfolio Breakdown**](/1/tracker/dashboard#portfolio-breakdown) table. These correspond to the 3 accounts sheets. Your first holding (the asset you just bought on your first trade) should now be listed under **ACCOUNT 1.**&#x20;

Like the Holdings Table, the Dashboard will automatically fill up with live stats and visualizations as you add more trades to your Trade Log.

Some of these charts may appear empty at first—they need more data to populate. But here’s an example of what you’ll see soon enough.

<figure><img src="/files/HOgczJ6L0te31GhgYP3N" alt="Portfolio Tracker – Premium Templates for Apple Numbers."><figcaption></figcaption></figure>

{% hint style="success" %}
**Optional:** If you’re using USD as your primary currency but would like your P\&L to be tracked in a [**secondary currency**](/1/tracker/secondary-currency) (in addition to the USD), you can do so.select a currency in the pop-up menu in <mark style="color:green;">**D1**</mark> at the very top of your Dashboard (The cell marked "**Alt Currency Picker**").  Once selected, you will see additional stats show up across your Portfolio Tracker.&#x20;
{% endhint %}

**That's it!  You're Portfolio Tracker is now set-up and ready to go!**&#x20;

#### Learn More:&#x20;

* [Tips and Tricks](/1/how-to/tips-and-tricks)
* [How to **change the primary currency.** ](/1/tracker/changing-the-primary-currency)
* [How to set a **secondary currency**. ](/1/tracker/secondary-currency)
* [Learn more about the **Accounts**.](/1/tracker/accounts)
* [Learn more about the **Dashboard**.](/1/tracker/dashboard)
* [Learn more about the **ROI Charts**. ](/1/tracker/roi-tool)
* [Learn how to create **Watchlists**.](/1/tracker/watchlists)
* [Lean how to make a **Special Assignation.**](/1/how-to/confused-asset-codes)
* [Sync using end-to-end encryption.](/1/how-to/turning-on-end-to-end-encryption)
* [Where can I use smol compute?](/1/how-to/what-devices-can-i-use-smol-compute-on)&#x20;


# Accounts

Overview of the Accounts Sheets

Accounts are the building blocks of your portfolio.  Each one is independent and self-contained.&#x20;

If you wanted to keep things simple, you could use only the account sheets, or even just a *single account sheet*, and you would still get a fully functional portfolio tracker replete with metrics and a ROI chart!&#x20;

Here's an overview of how accounts work:&#x20;

## Account Type

Each account can either be a *crypto* account or a *stocks* account. If you enter crypto trades into a stocks account (or vice-versa), the automatically generated [**Holdings**](#holdings) table won't be able to properly recognize the asset codes you enter into the [**Trade Log.**](/1/tracker/accounts#trade-log)&#x20;

You define the account type by choosing from the pop-up menu at the very top of each account's page, in cell **B1**.&#x20;

<figure><img src="/files/hPovAC24ICLbwvK8v6xF" alt="Choosing the account&#x27;s type"><figcaption><p>Choosing the account's type</p></figcaption></figure>

## Top Line Sats

At the very top of the sheet, you can see your portfolio's current stats, such as:&#x20;

* your portfolio's **overall P\&L** in USD terms
* your portfolio's **overall P\&L** in % terms
* its **current value**&#x20;
* it's **cost** (the capital you have put in minus the capital you have taken out)
* your **realized P\&L**
* the **current unrealized P\&L** on the assets currently held in the account. &#x20;

If you have selected a secondary currency on the Dashboard, additional stats in that currency will show up on the rightmost column of the Top Line, and the currency you have selected will be displayed in C1.&#x20;

{% hint style="info" %}
**Tip:**  The **Realized P\&L** is likely to be the amount you should keep an eye on for taxes!&#x20;
{% endhint %}

The only cell you should edit here is **the account's** **type** (B**1**).

<figure><img src="/files/LsWmtXlhK2lDHGdjqDx6" alt="Account&#x27;s Top Line Stats"><figcaption><p>Account's Top Line Stats</p></figcaption></figure>

## Account's ROI Chart

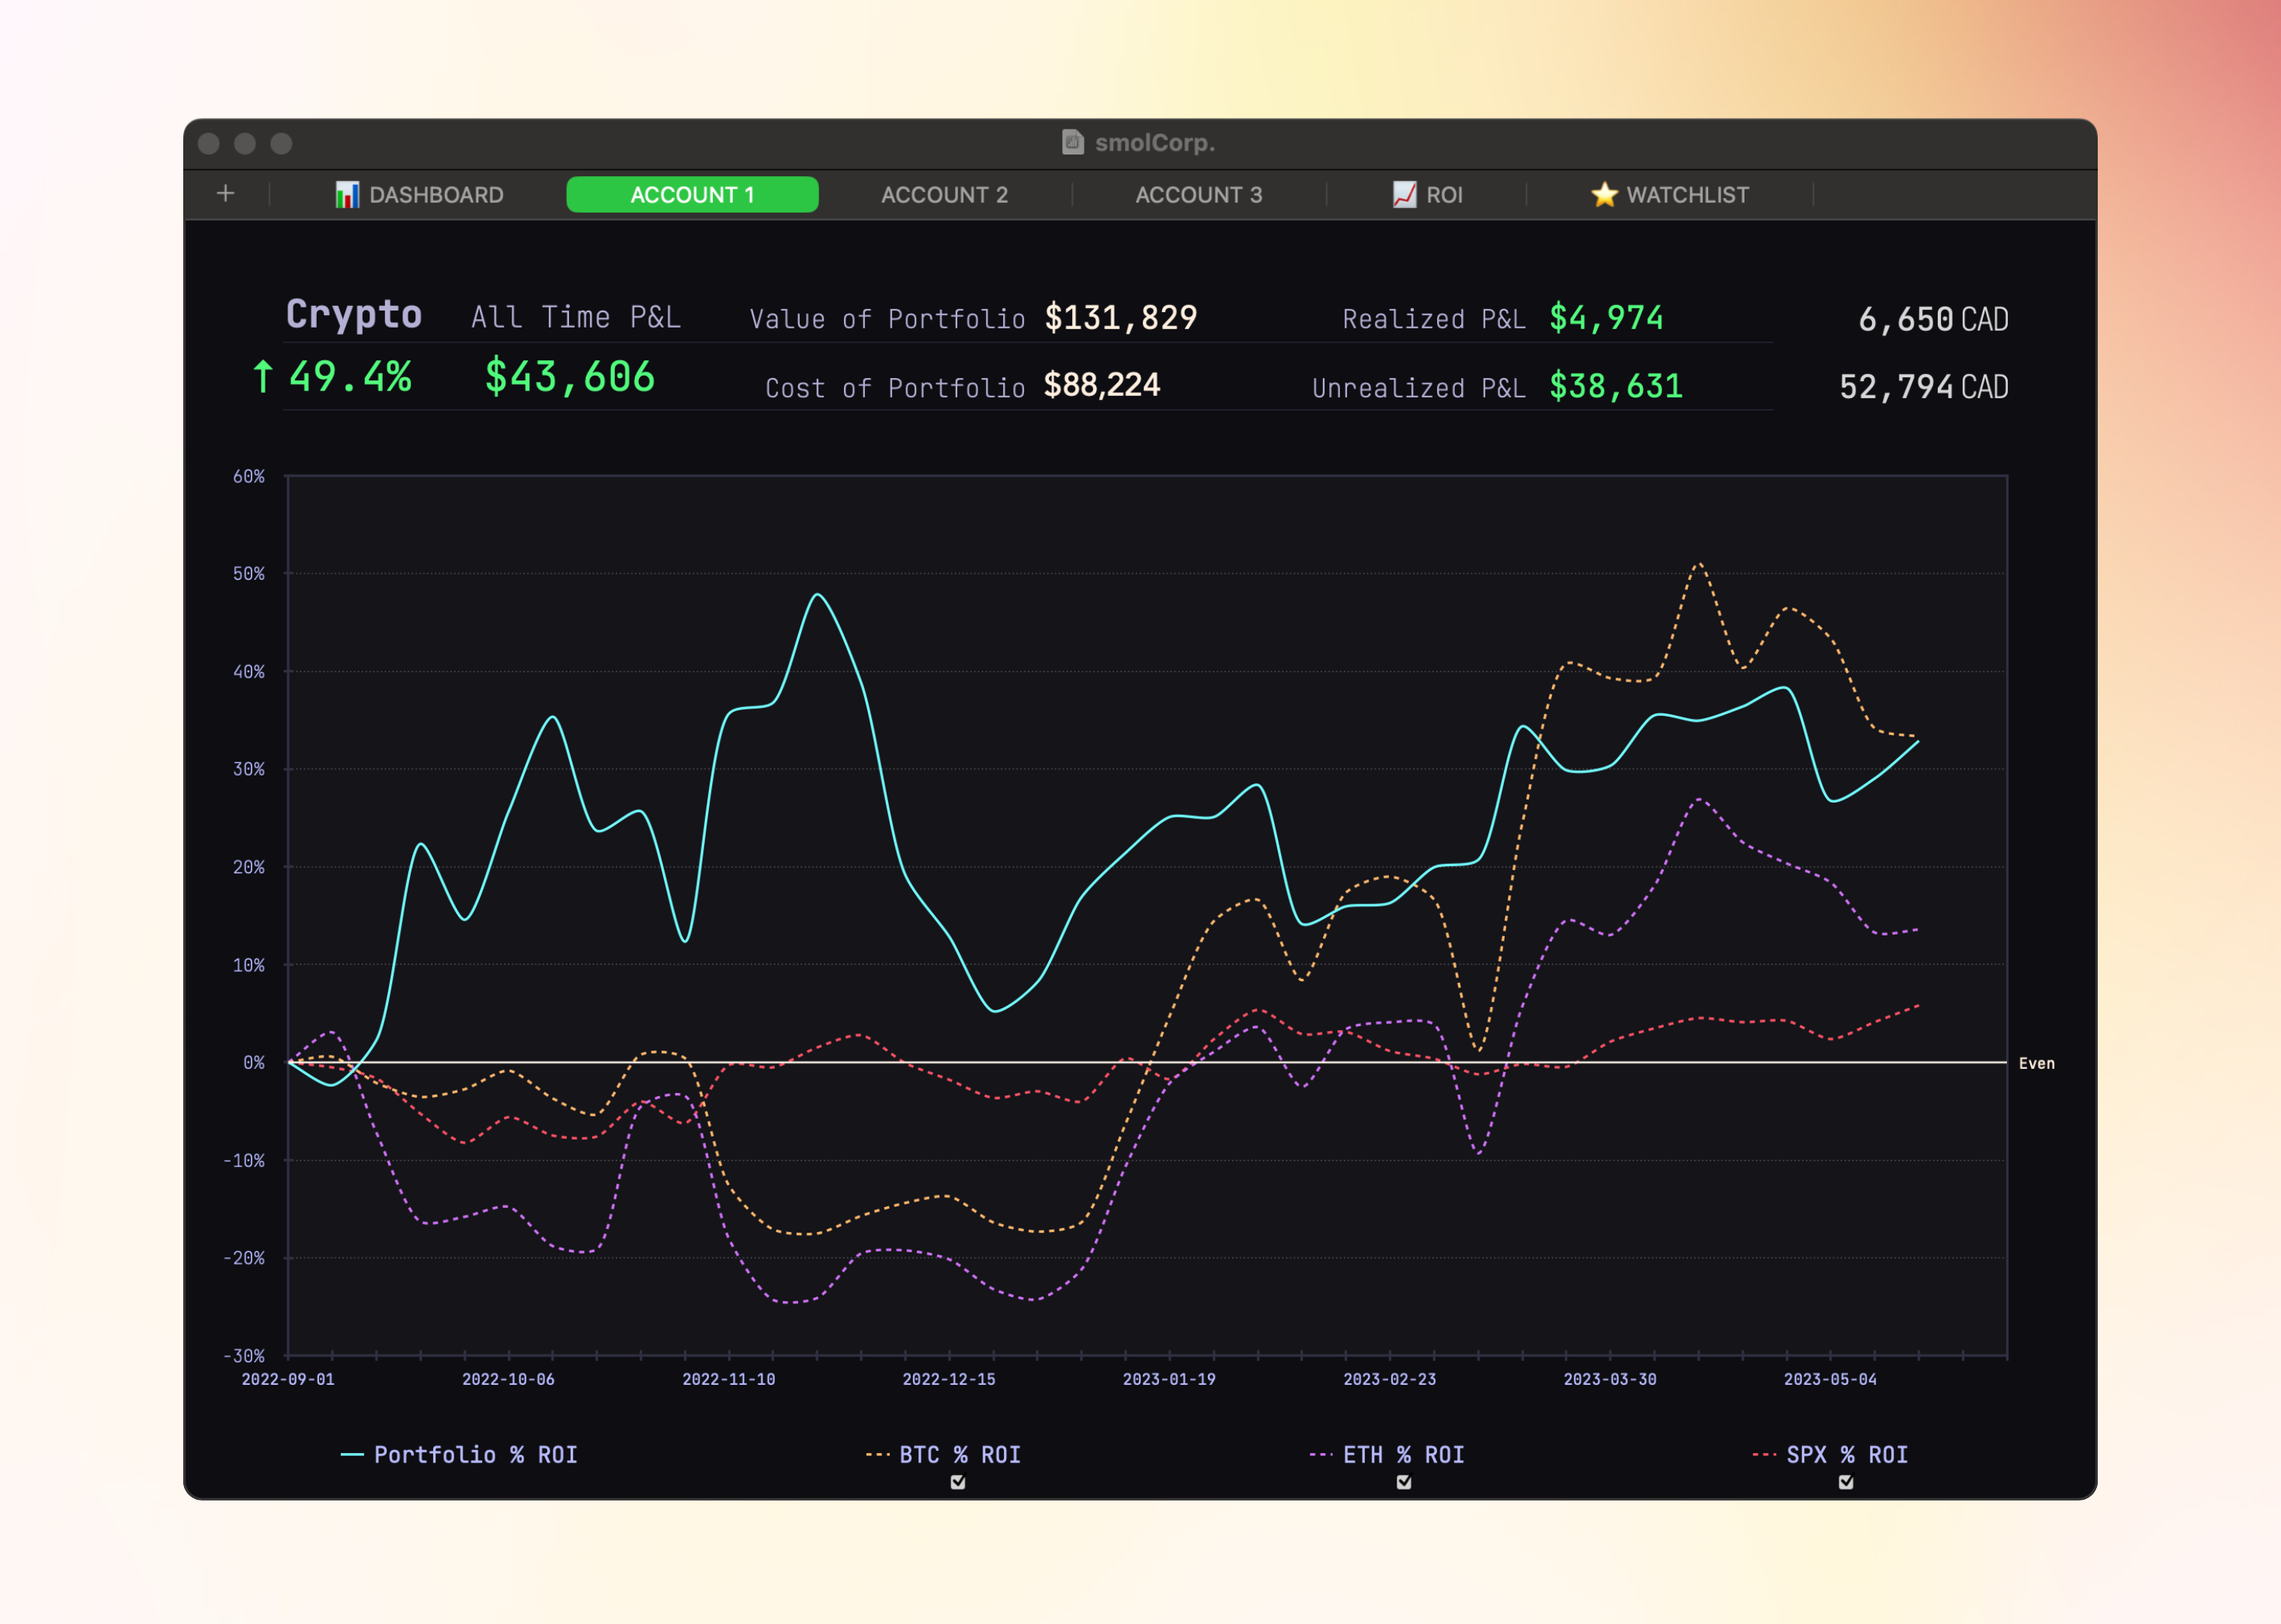
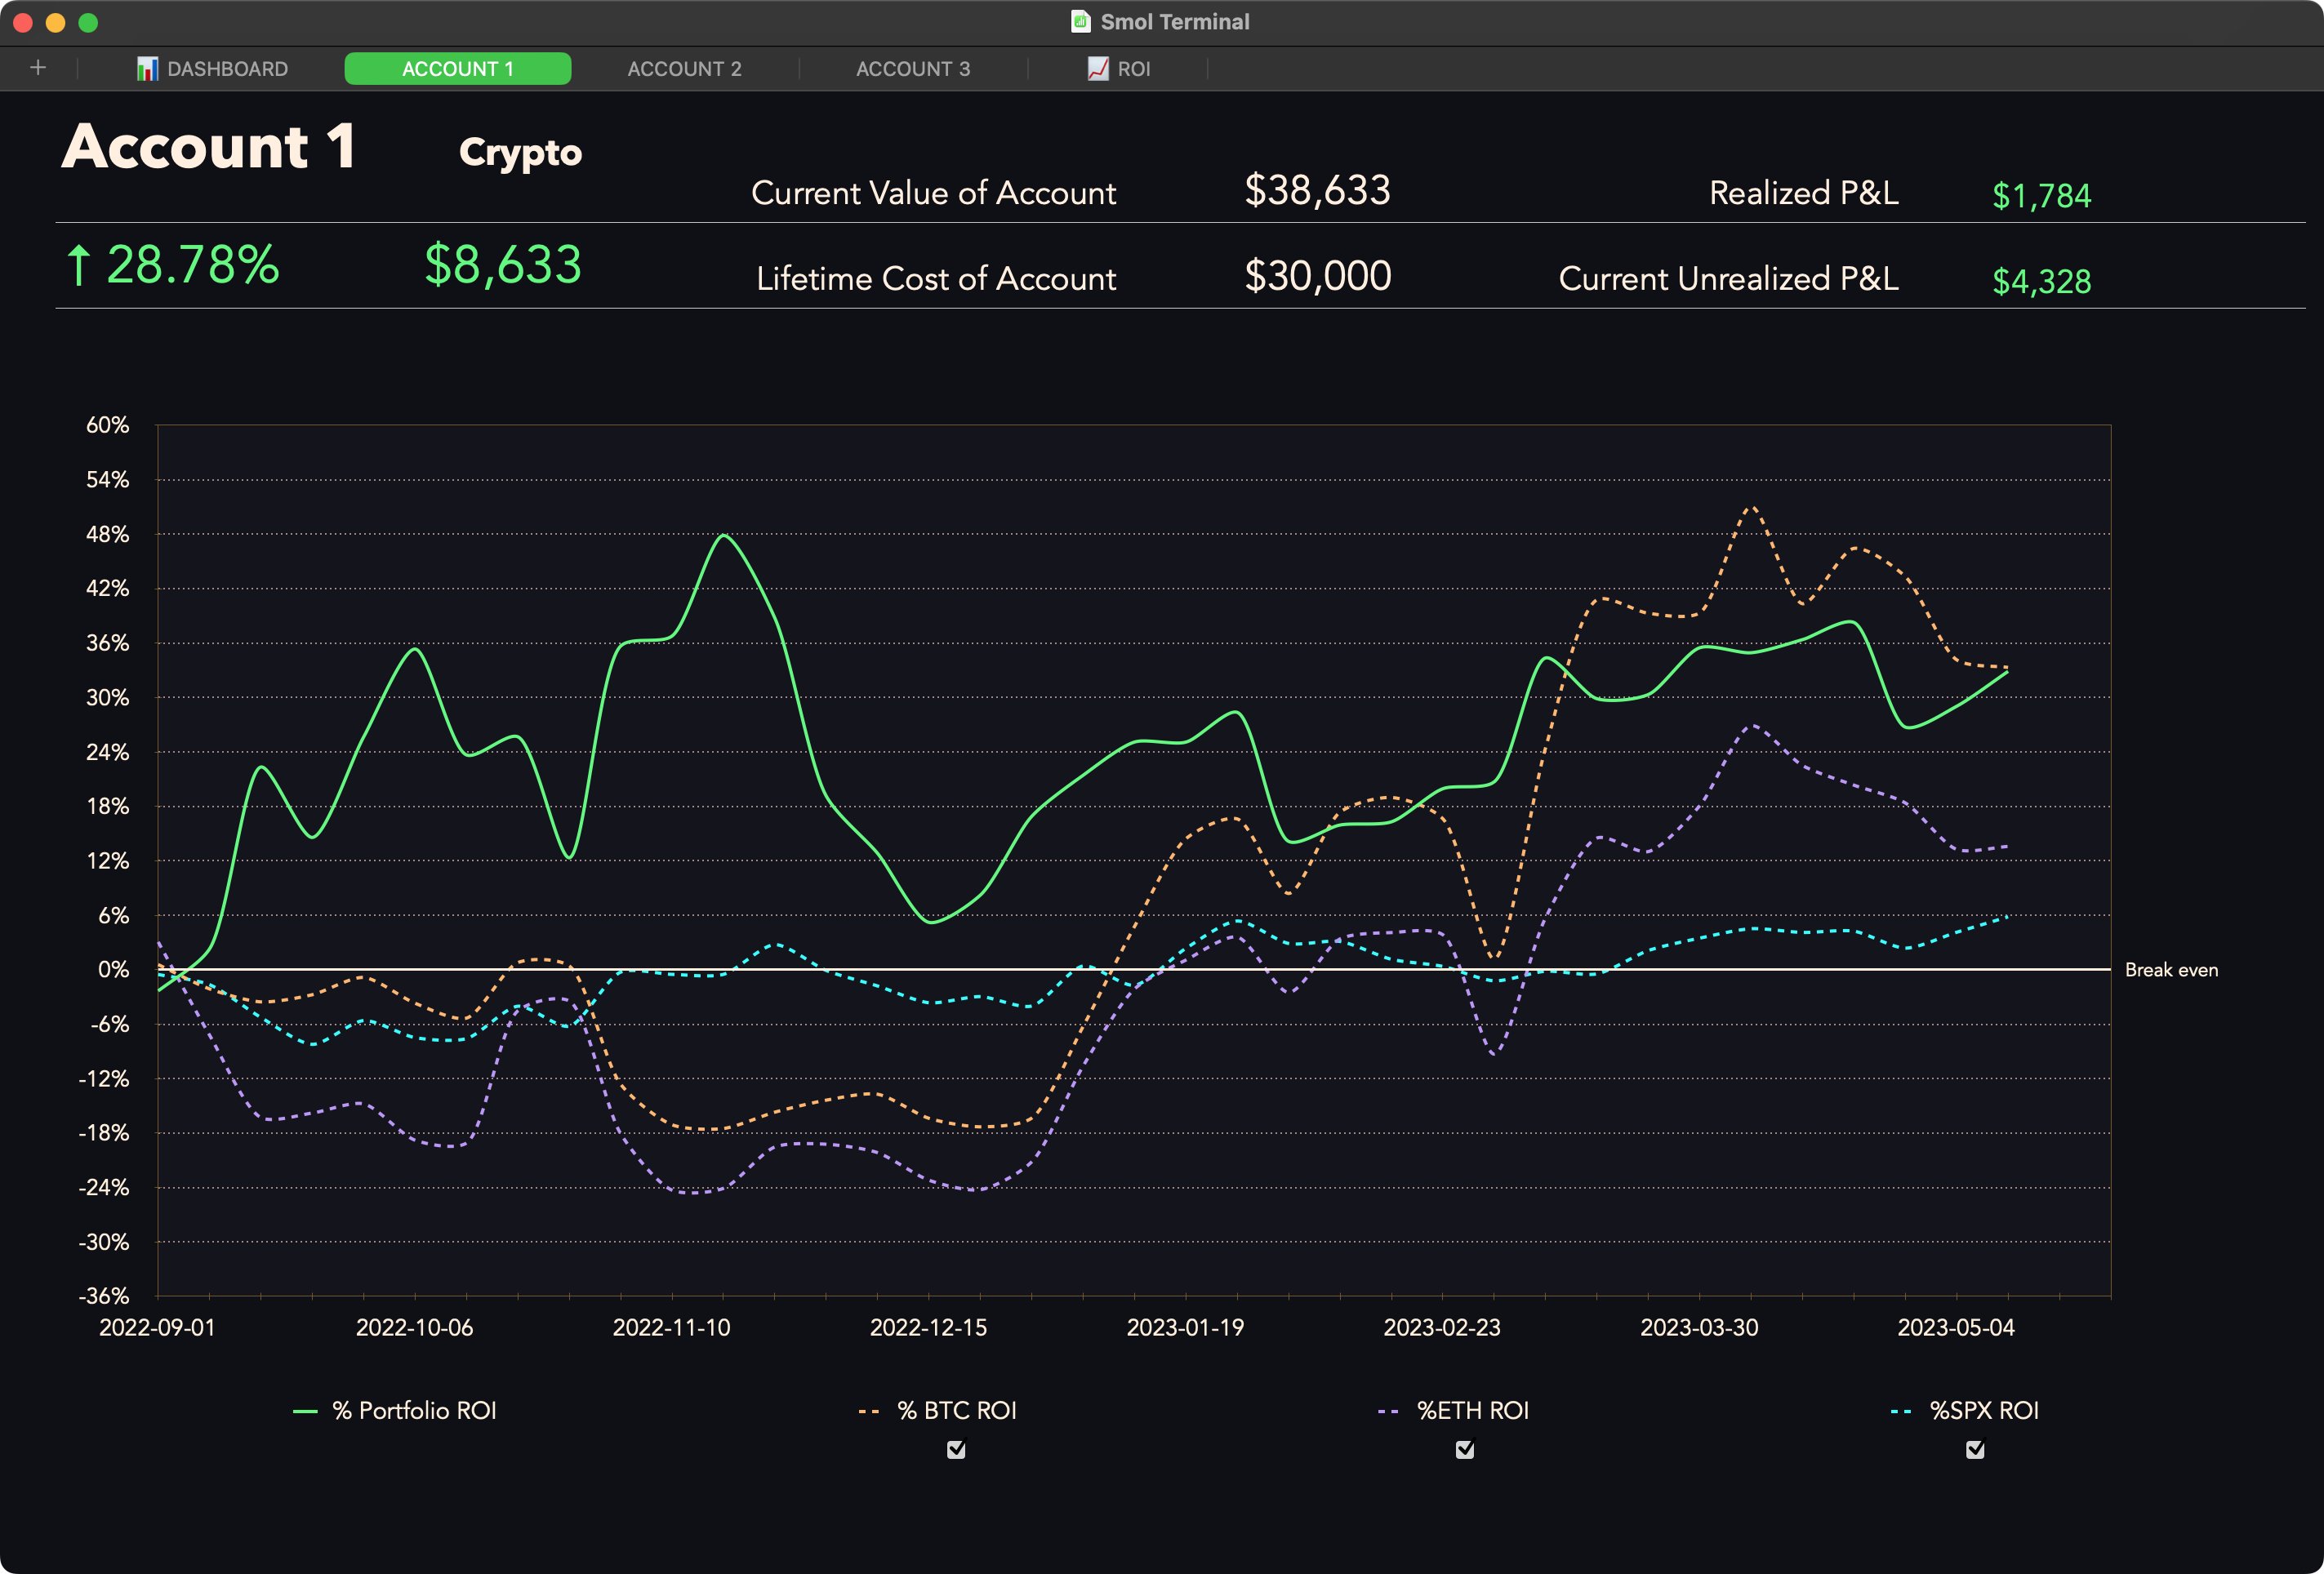
Right below the **Top Line Stats** is the Account's ROI Char&#x74;**.**  This chart works in tandem with the [**Snapshots**](/1/tracker/accounts#snapshots) table to plot your % ROI over time. &#x20;

To help you see how your account is performing, the chart also plots **3** **benchmarks** ( the % ROIs of **Bitcoin**, **Ethereum**, and the **S\&P 500**).  &#x20;

You can quickly enable / disable benchmarks by clicking on the checkbox underneath the name of the respective benchmarks in the chart's legend (see screenshot below).

The **starting date** for this ROI calculation is set when you enter your very first snapshot in the [**Snapshots**](#snapshots) table. Each time you take a new snapshot, a data point is added to the ROI Chart. New data points are likewise added for each benchmark. Over time, you can start seeing your account's performance plotted against those of these benchmarks.&#x20;

<figure><img src="/files/7wQgyA7q907kiNdrE5Y0" alt="Crypto Portfolio Manager for Apple Numbers "><figcaption><p>Account ROI Chart</p></figcaption></figure>

## Holdings

Right below the **ROI chart**, you'll find the account's **Holdings table.**&#x20;

*This table is entirely auto-generated.* It will appear rowless until you begin entering trades in the Trade Log. A new row will be automatically added for each new asset you trade in one of your accounts. It will then pull live price data from [Yahoo Finance](https://finance.yahoo.com/) and [CoinMarketCap](https://coinmarketcap.com/) in order to give you rich metrics about your account:&#x20;

<figure><img src="/files/Wxt6SEgFeWly2GajaPmO" alt="Portfolio Tracker – Premium Templates for Apple Numbers."><figcaption><p>The self-generated Holdings table.</p></figcaption></figure>

1. **Ticker** (The asset codes you've entered in the [**Trade Log**](/1/smol_tracker/trade-log))
2. **Asset's name.** You can click these to be brought to the Asset's page on Yahoo Finance.
3. **Current Holdings** (number of units currently owned for each asset).
4. **Daily % Change** in price of the asset.
5. **Current Price** of the asset.
6. **Cost / Unit** (The total cost of your *current holdings* of the asset divided by the number of units *currently owned.* This is your current cost basis per unit.&#x20;
7. The price at which you **last transacted** this asset.&#x20;
8. Whether your **last transaction** of this asset was a BUY or a SELL.&#x20;
9. The **current value** of your holdings of this asset.&#x20;
10. The total **cost of your current holdings** for the asset (similar to 6.)
11. The current **$ amount gains or losses** on your *current holdings* of the asset.&#x20;
12. The current **% gains or losses** on your *current holdings* of the asset.&#x20;
13. Current R on your current holdings for this asset.
14. The **$ amount of realized gains or losses** for this asset. This is especially relevant for tax purposes.
15. The **$ amount of realized gains or losses** for this asset calculated in the secondary currency of your choice (if any). These amounts take into account the conversion rate on the day of each of your realized events so as to be as precise as possible. This is especially relevant for tax purposes.
16. The **Total $ Cost** for this asset: (*cost of current holdings* plus or minus any *realized gains or losses for this asset*)
17. The **Total $ Gains** for this asset: The current unrealized gains or losses plus the realized gains or losses for this asset.&#x20;
18. The **% share of your portfolio** this asset represents.&#x20;

{% hint style="info" %}
**Tip: Clickable asset names.**  You can now click on an asset' name in your Holdings, Portfolio Breakdown, Watchlists, etc. Doing so will bring you to the asset's page on Yahoo Finance where you can see live advanced charts (line, candles, bars),  relevant news, and  much more.  This works for all supported assets, and respect your selections in special assignations if you have made any.&#x20;

<img src="/files/vQigqrkcDQ9TChrHnqLC" alt="" data-size="original">
{% endhint %}

{% hint style="info" %}
While crypto price data is continually refreshed throughout the day, stocks prices are usually the most recent "close" price, i.e., the price of the asset at the end of the last trading day. Sadly, this is a current limitation imposed by Yahoo's own API. Hopefully continual live price updates will be forthcoming.&#x20;
{% endhint %}

## Trade Log

Right below the Holdings table is the **Trade Log.** &#x20;

<figure><img src="/files/lgD1uZOXlCduUrFPoRIf" alt="Portfolio Tracker – Premium Templates for Apple Numbers."><figcaption><p>The Trade Log</p></figcaption></figure>

The Trade Log is composed of 4 sections:&#x20;

* The first section is where you enter your trades (lighter cells).
* &#x20;The second section automatically displays useful updated stats about your holdings, reflecting the trade you just added to your Trade Log.&#x20;
* The third section displays the P\&L VS Current price and the final P\&L of each ***realized event*** (aka a SELL entry in the trade log), basically telling you how much money you made or loss on the trade.&#x20;
* The fourth section is for optional comments on your trade.&#x20;

{% hint style="info" %}
You only need to enter data in the *first section* of the Trade Log. The other other 2 main sections will self-populate to reflect the trade you just entered.&#x20;
{% endhint %}

### Trade Entry Section

The **first 7 columns** (the lighter ones) are where you enter your trades. This is self-explanatory, but let's go over the details.&#x20;

<figure><img src="/files/K0hrlxwv0gKW10pdaOH4" alt="Trade Log&#x27;s Entries Section" width="563"><figcaption><p>Trade Log's Entries Section</p></figcaption></figure>

* **Date**: the date of the trade.  This column is pre-formatted to use a universal standard.

{% hint style="warning" %}
Please note that the date should be precise enough to allow for *<mark style="color:green;">**chronological sorting**</mark>* of your trades. In some cases, the ***time*** of the trade , in addition to its date, will be necessary (e.g., if you are both buying *and* selling the same asset **on the&#x20;*****same day***).&#x20;
{% endhint %}

{% hint style="info" %}
**Tip:**   A quick way to enter the *exact date and time* is via the application's menu.&#x20;

Go to Table > Insert Current Time (this will enter *both* the date and the time down to the second). &#x20;

Even quicker:  hit  **Control - Shift - Command - T**

If you are batch-importing your trades via the [smol Formatter](/1/formatter), the correctly formatted date and time will carry over.&#x20;
{% endhint %}

* **Account:** This is for optional metadata (E.g., Binance, Robinhood, 0xacB69, TFSA)
* **Side:** BUY or SELL (or FEES, see box below).&#x20;
* **Market:** The asset code (ticker) of the asset traded.
* **Quantity:** The number of units bought or sold.
* **Price:** The USD price the asset was traded at.
* **Fees:** Optionally, any fees incurred for that trade. The fees you enter here will be added to your **cost basis** for that specific asset and will be reflected in your final P\&L.

{% hint style="info" %}
In addition to "BUY" and "SELL", the **Side** column offers you a third option, **"FEES".**  The reason is that, in crypto, there are often network fees to pay even when we are not buying or selling. Each time we interact with the blockchain, we must pay a gas fee. These fees impact your final P\&L. *The FEES option allows you to log these fees and* *add them to the cost basis of the asset concerned in the blockchain interaction.&#x20;*&#x20;
{% endhint %}

<figure><img src="/files/QJJOda2MFYffqTattyZQ" alt=""><figcaption><p>Network fees entered for the PENDLE token.</p></figcaption></figure>

### Stats Section

The **Stats** section maintains important values updated with each event, such as the updated total of units owned for the asset  as well as its updated cost basis. Many will find these columns informative and useful, but they can also be hidden if you don't have any use for this information. Do not delete them though.&#x20;

<figure><img src="/files/y8xrdP7ElVmg5o0PlO27" alt="" width="375"><figcaption><p>Trade Log's Stats Section</p></figcaption></figure>

### P\&L Section

The third section of the Trade Log computes your **P\&L**<mark style="color:purple;">**.**</mark>&#x20;

The first column (**% P\&L VS Current Price**) tells you in % terms how much higher or lower the current price is vis a vis the price transacted at (for each row / transaction). If the row registers a SELL event, the calculation is inverted, so that if the currenrt price is higher than the price you sold at, you will see a negative % P\&L. &#x20;

The second column (**$ P\&L VS Current Price**) uses that percentage and multiplies it by the $amount transacted, letting you know in $ terms how much you may have gained or lost. N.B: *These columns are purely for informational use and do not affect in any way the calculation of your account's P\&L.*&#x20;

Each time you SELL an asset you own, the  third and fourth columns display your final realized P\&L both in % terms and in $ terms  (proceeds of units sold minus cost of units sold). These figures also takes into account any fees you may have entered for this asset, both in the Fees column (when entering a  BUY or SELL event), or via the FEES entry (see box above). &#x20;

If you [set a secondary currency](/1/tracker/secondary-currency)**,** your P\&L will also be displayed in that secondary currency in the fifth column,  taking the exchange rate in effect *on the date you have entered in column A.*&#x20;

<figure><img src="/files/nkH9LaJNhTSQMA497ySm" alt="" width="563"><figcaption><p>Trade Log's  P&#x26;L Section</p></figcaption></figure>

### Sorting the Trade Log

You can **sort your trades** by header columns.  The main utility of this is the ability to add trades to to the Trade Log and not have to worry about entering them in perfect chronological order. You can simply add trades to the bottom of the list and then sort the list by dat&#x65;**,** and everything will then get computed correctly.

*Note that the Trade Log computes trades from **top to bottom,*** so trades MUST be *sorted* chronologically to be correctly computed. For example, you obviously can't sell something you have not already bought. But even if you do not *enter* them chronologically, you can simply ***sort*** ***by date*** and everything will recompute accordingly so long as the dates you have entered are correct.&#x20;

A good use case might be if you are using more than one exchange to trade Bitcoin, but want still want all these trades computed as one (say, for tax purposes). You want to know your P\&L and cost basis for Bitcoin ***across all Exchanges,*** not just on one exchange. Simply enter all your trades in the Trade Log and then sort by date and your costs basis and P\&L will be correctly computed across all exchanges, wallets, etc. (Use the Smol Formatter if you want to bulk import trades).

<figure><img src="/files/MdE8uCefWFsonzLCiMrX" alt=""><figcaption><p>Sorting your Trade Log by by date.</p></figcaption></figure>

## Snapshots

The Snapshots table captures important values about your account at different moments in time. These temporal data points are then used to track and display your account's performance *through time*. The[ **Account's ROI Chart**](#accounts-roi-chart) plots data from this table. So do the different charts of the [**ROI tool** ](/1/tracker/roi-tool)and the **Portfolio Value Chart** on the **Dashboard**.&#x20;

When you first set up your Portfolio Tracker, you create a first "snapshot" of your account's value and cost, a baseline, with an ROI of 0. As the value of your holdings change, so does your account's value of course. Furthermore, when you add capital to, or retrieve capital from, the account, the cost of your account change. These changes are reflected in your account's return on investment or ROI. The snapshots are a record of your account's past performance.&#x20;

To make things as simple as possible, the **current values** (updated with current asset prices) are continually displayed in bright blue in the box labeled "Current Values". To make a snapshot, simply copy these values (in blue), and paste them below, in the table using **Shift + ⌘+ V** (or Edit > Paste Formula Results). &#x20;

<figure><img src="/files/yavrNlNSiK5dJO2QyWxq" alt=""><figcaption><p>How to take an Account's Snapshot</p></figcaption></figure>

Immediately, your [Account's ROI Chart](#accounts-roi-chart) will display this first snapshot. As you add snapshots over time, the chart will begin to draw a smoothed blue line representing your account's performance over time.&#x20;

<figure><img src="/files/1WdS60WjsFTiljPxAxEH" alt=""><figcaption><p>The Smoothed-out Account's ROI Drawn from the Snapshot history. </p></figcaption></figure>

# The Dashboard

An Overview of the Dashboard

Whereas [**Accounts** ](/1/tracker/accounts)are self-contained and fully independent (mini portfolio trackers all to themselves), the **Dashboard** and the [**ROI tool** ](/1/tracker/roi-tool)pull data from all your accounts to give you a full picture of your portfolio.&#x20;

The **Dashboard** allows you to quickly see how you're allocated across your accounts, monitor the total P\&L of your portfolio, sort your portfolio by a wide selection of metrics, and quickly track how your net worth has progressed over time.

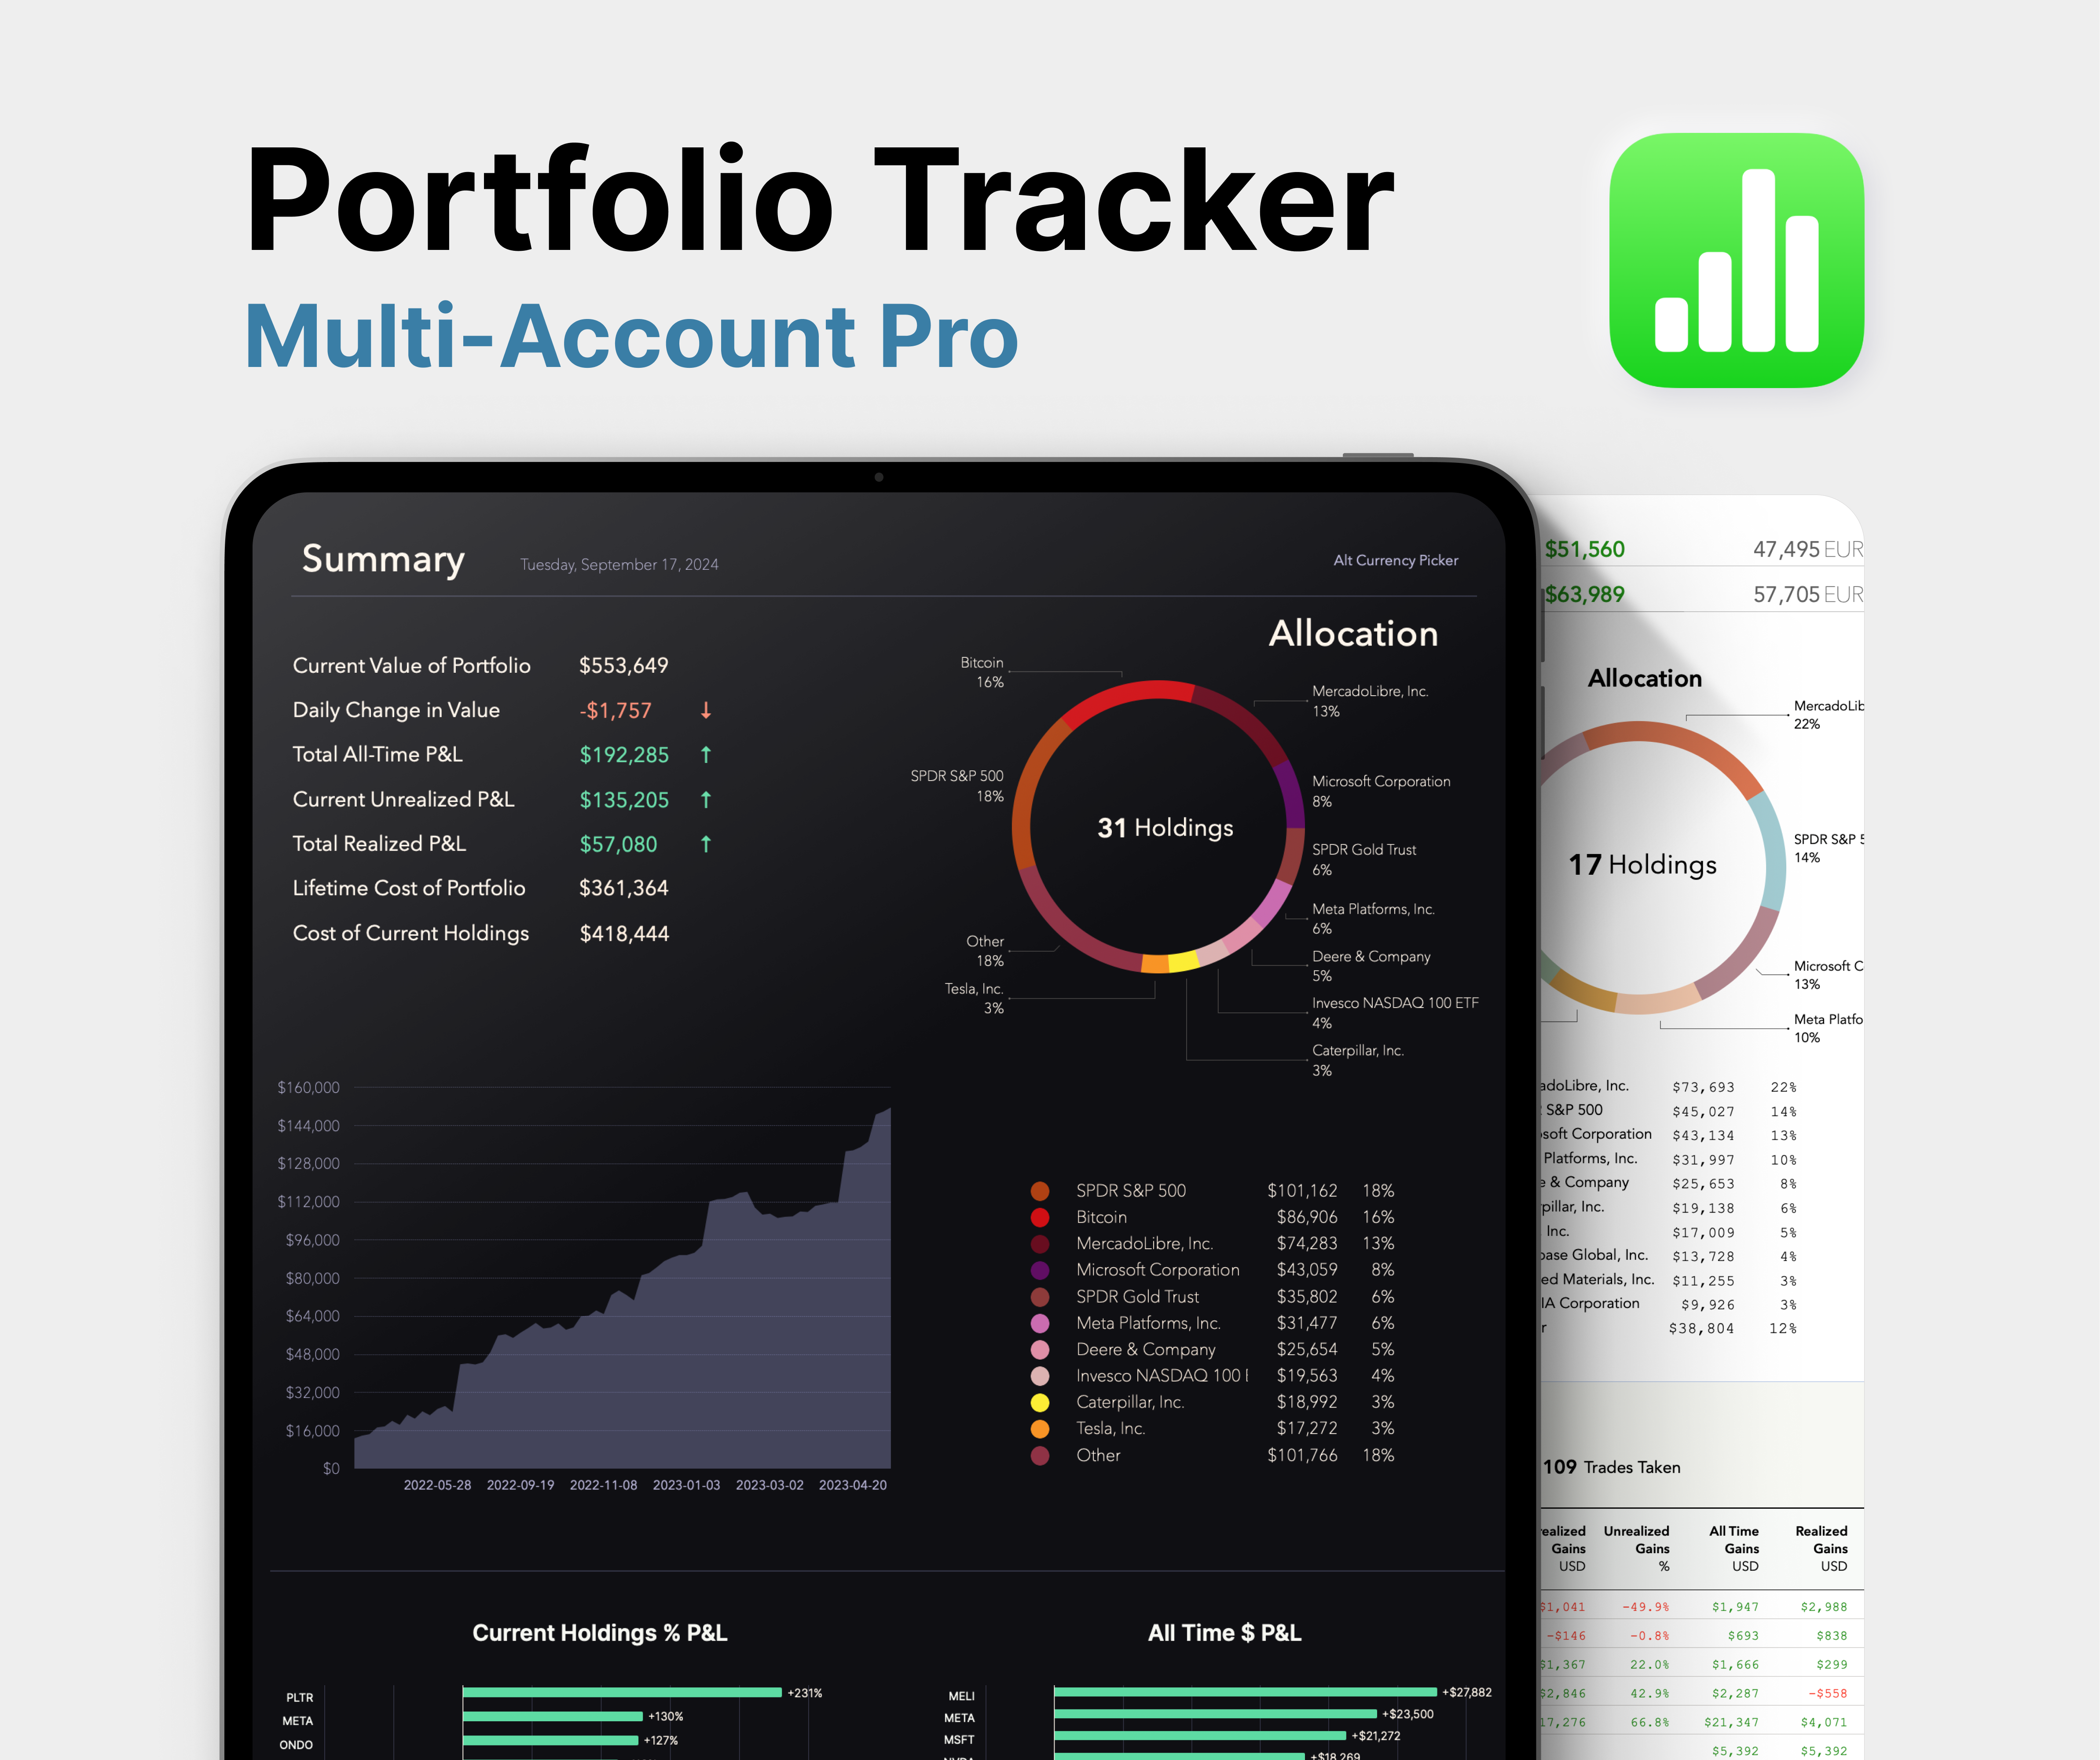
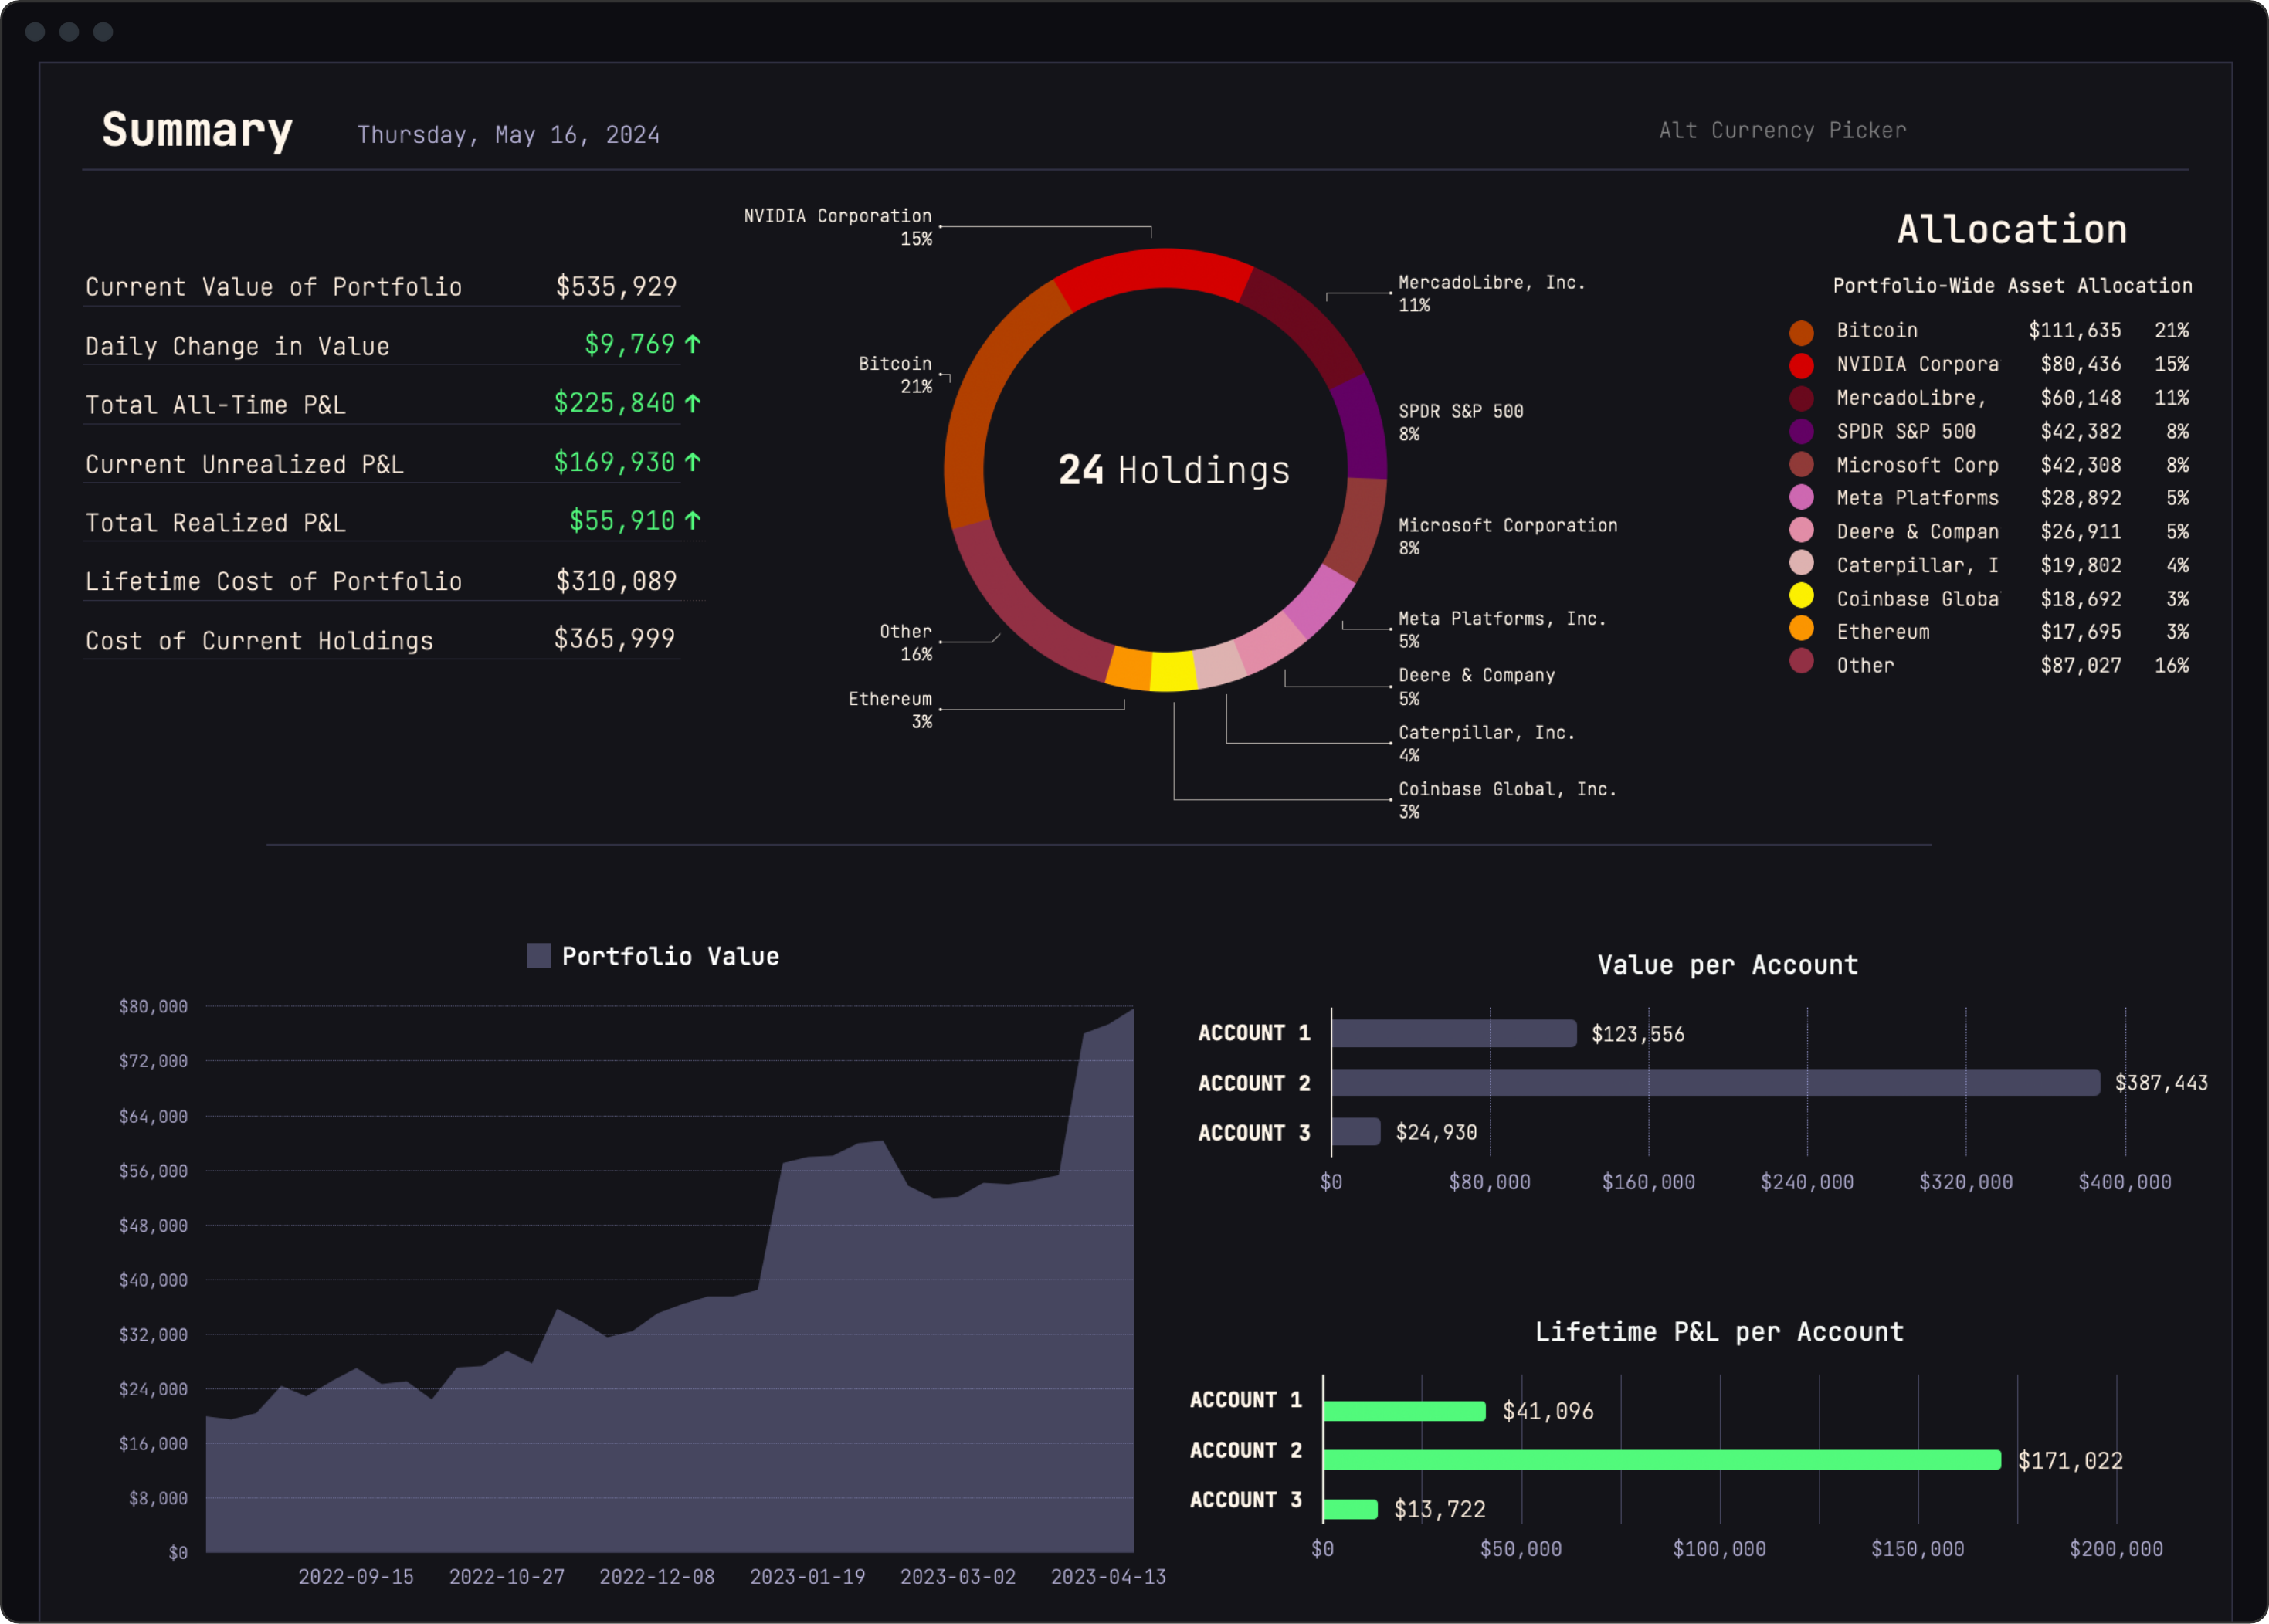
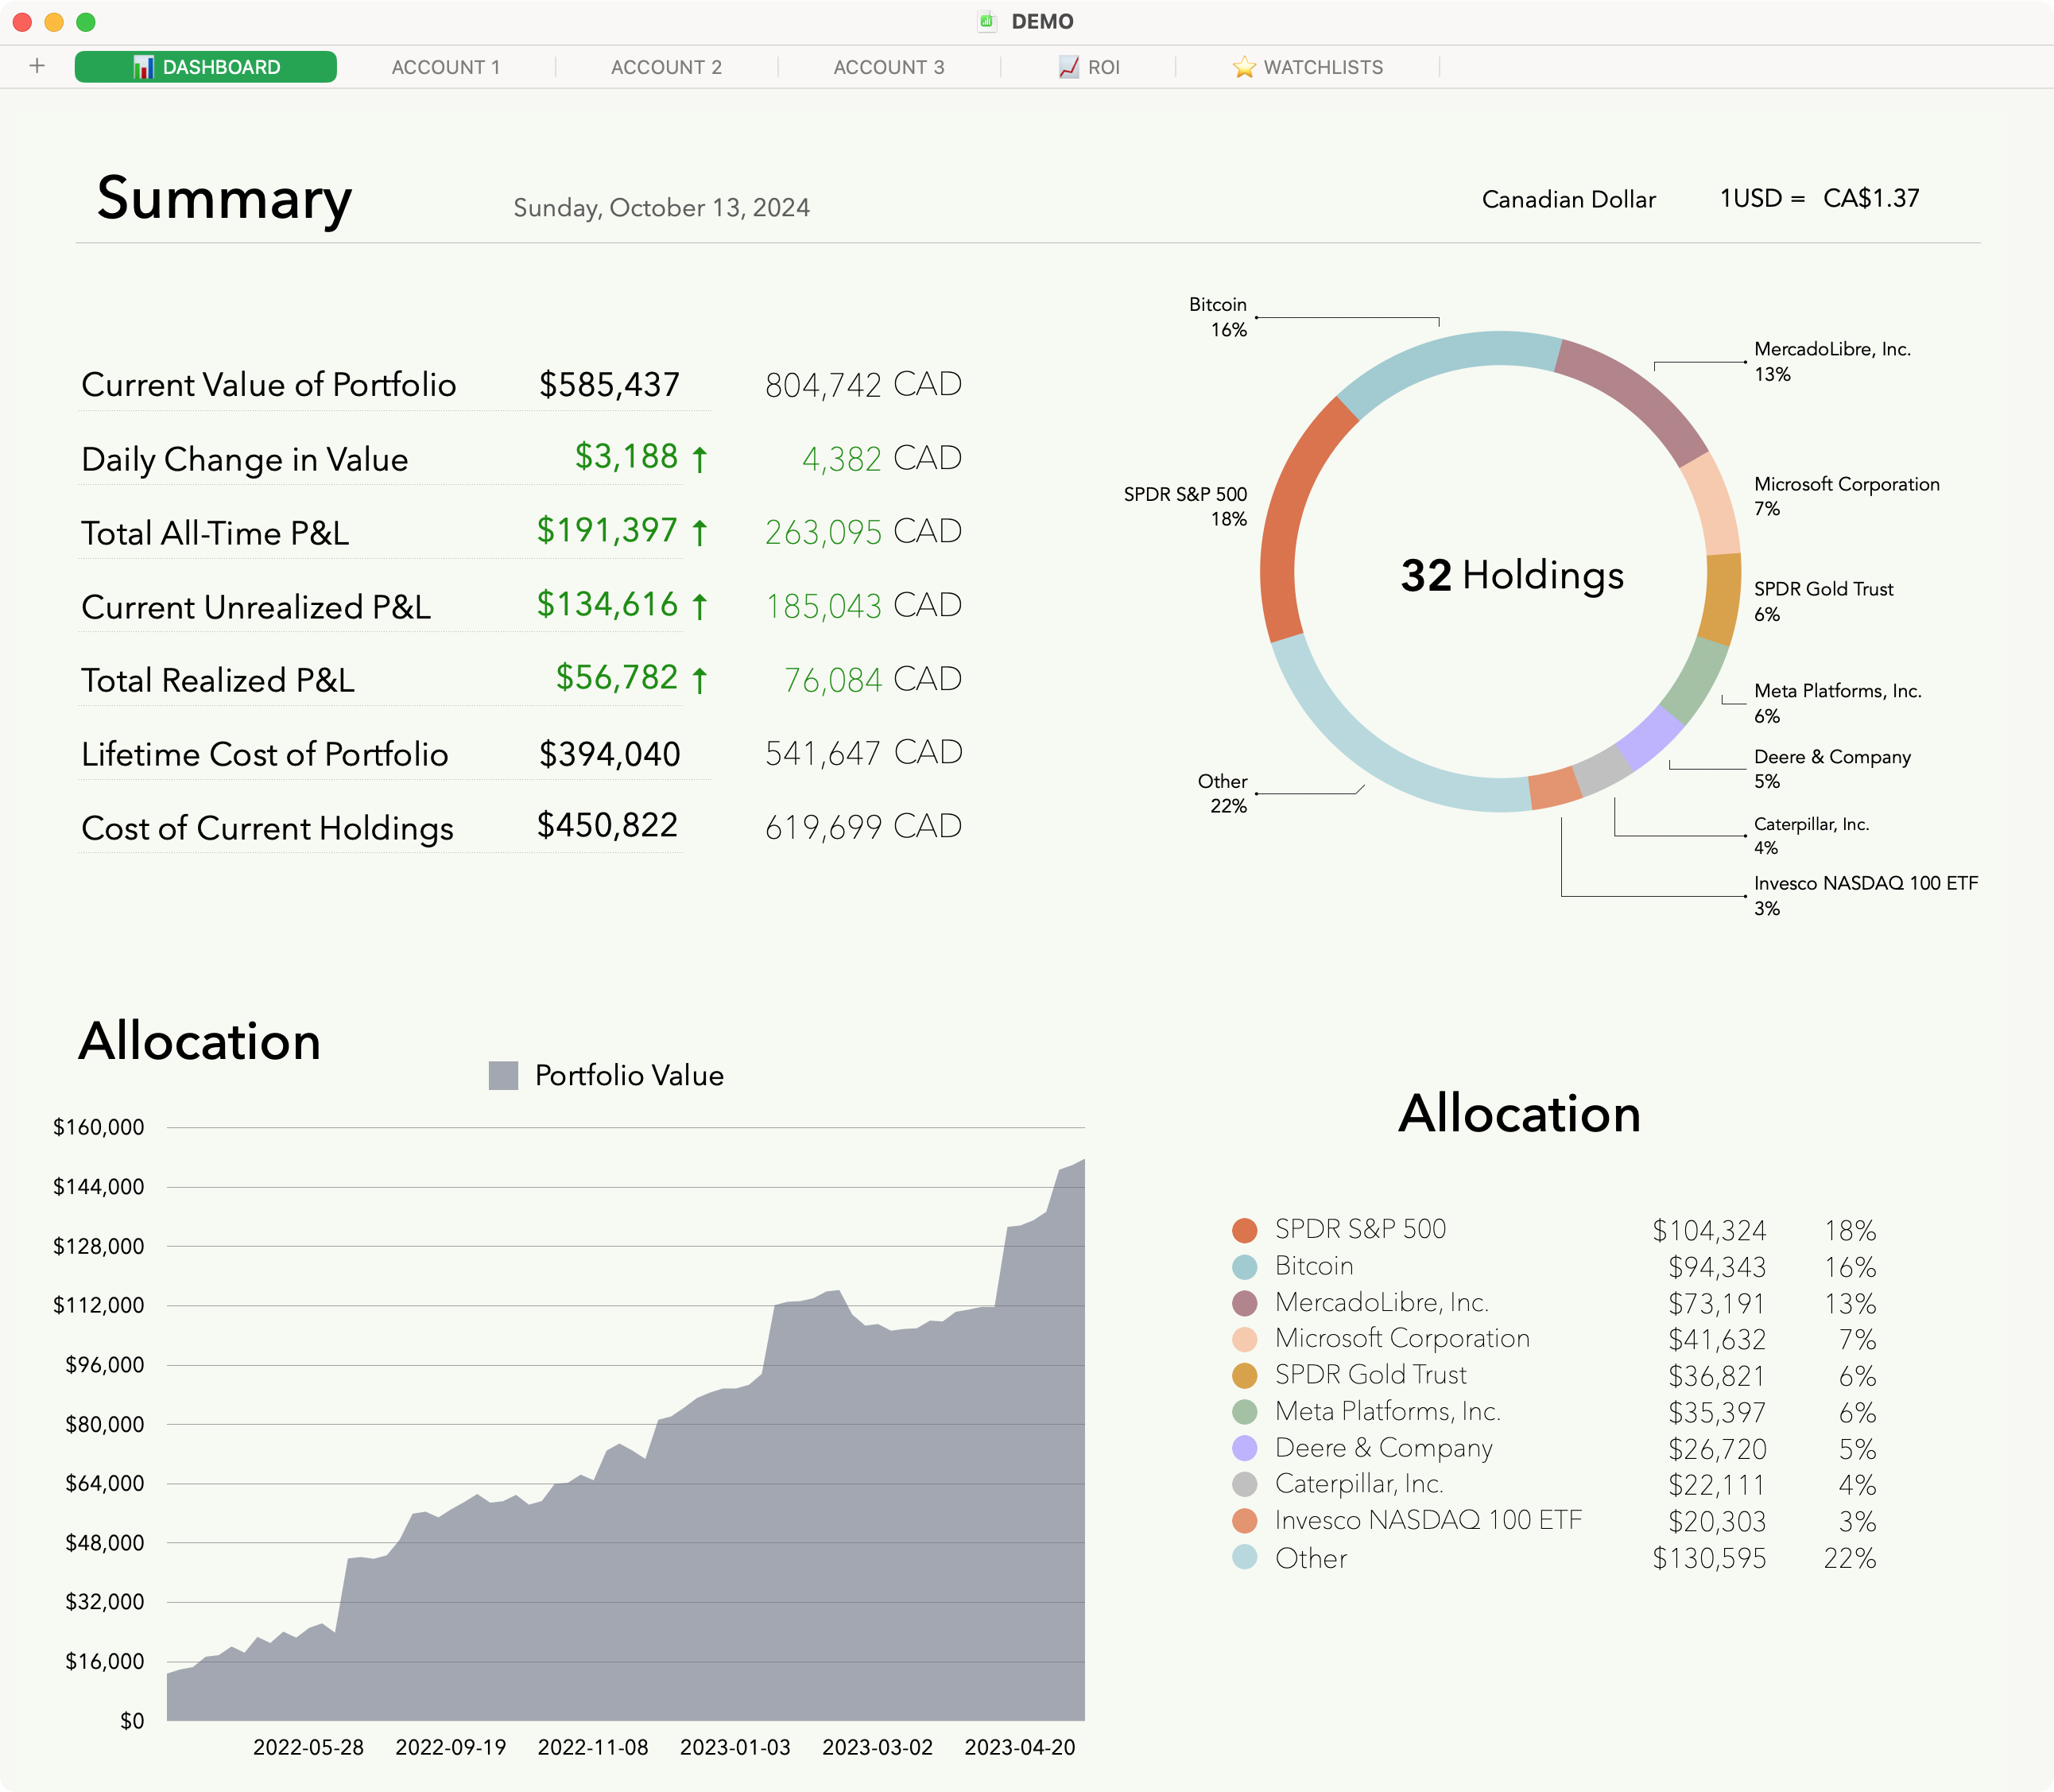
The Dashboard is divided in two zones, the **Portfolio Summary** and the **Portfolio Breakdown.** Note that you have nothing to do here. The Dashboard will self-populate in real time as you update your accounts with trades.&#x20;

## Portfolio Summary

<figure><img src="/files/aP7h3TbJppLsk0n9whpQ" alt="Portfolio Tracker – Premium Templates for Apple Numbers."><figcaption><p>Portfolio Summary</p></figcaption></figure>

The Portfolio Summary is made up of a collection of widgets each displaying important and useful stats about your portfolio as a whole.&#x20;

Top left, you'll find your portfolio's **Top Line Stats**:

* The total **current value** of your portfolio (this number updates continually via the integrated price feeds).
* The **lifetime cost** of your portfolio (all deposits minus all withdrawals of capital across all accounts).
* The **portfolio's P\&L** (the current value of your portfolio minus its lifetime cost).
* The **total realized P\&L** (the proceeds of all sells minus the cost of all units sold).&#x20;

Right below is a chart providing you with the historical progression of your portfolio's total value.&#x20;

### Allocation Widget

In the top right corner is the **Allocation widget**. Here you can see your whole portfolio broken down in % terms for different assets across all your accounts. &#x20;

If you hold Bitcoin in more than one account, for example, the allocation widget will aggregate all your Bitcoin holdings and tell you what % of your entire portfolio they represent.&#x20;

{% hint style="info" %}
You can set which assets you want to displayed individually. Everything not given an individual, colored segment will be part of the "Other" segment.&#x20;
{% endhint %}

To assign an asset its own segment, write its name (as it appears in the [Portfolio Breakdown](#portfolio-breakdown)) in column A.&#x20;

<figure><img src="/files/FKG6NxF0Lhq5Fs2fc1hu" alt="Portfolio Allocation Portfolio Tracker – Premium Templates for Apple Numbers." width="563"><figcaption><p>Portfolio Allocation widget</p></figcaption></figure>

### Alt Currency Picker

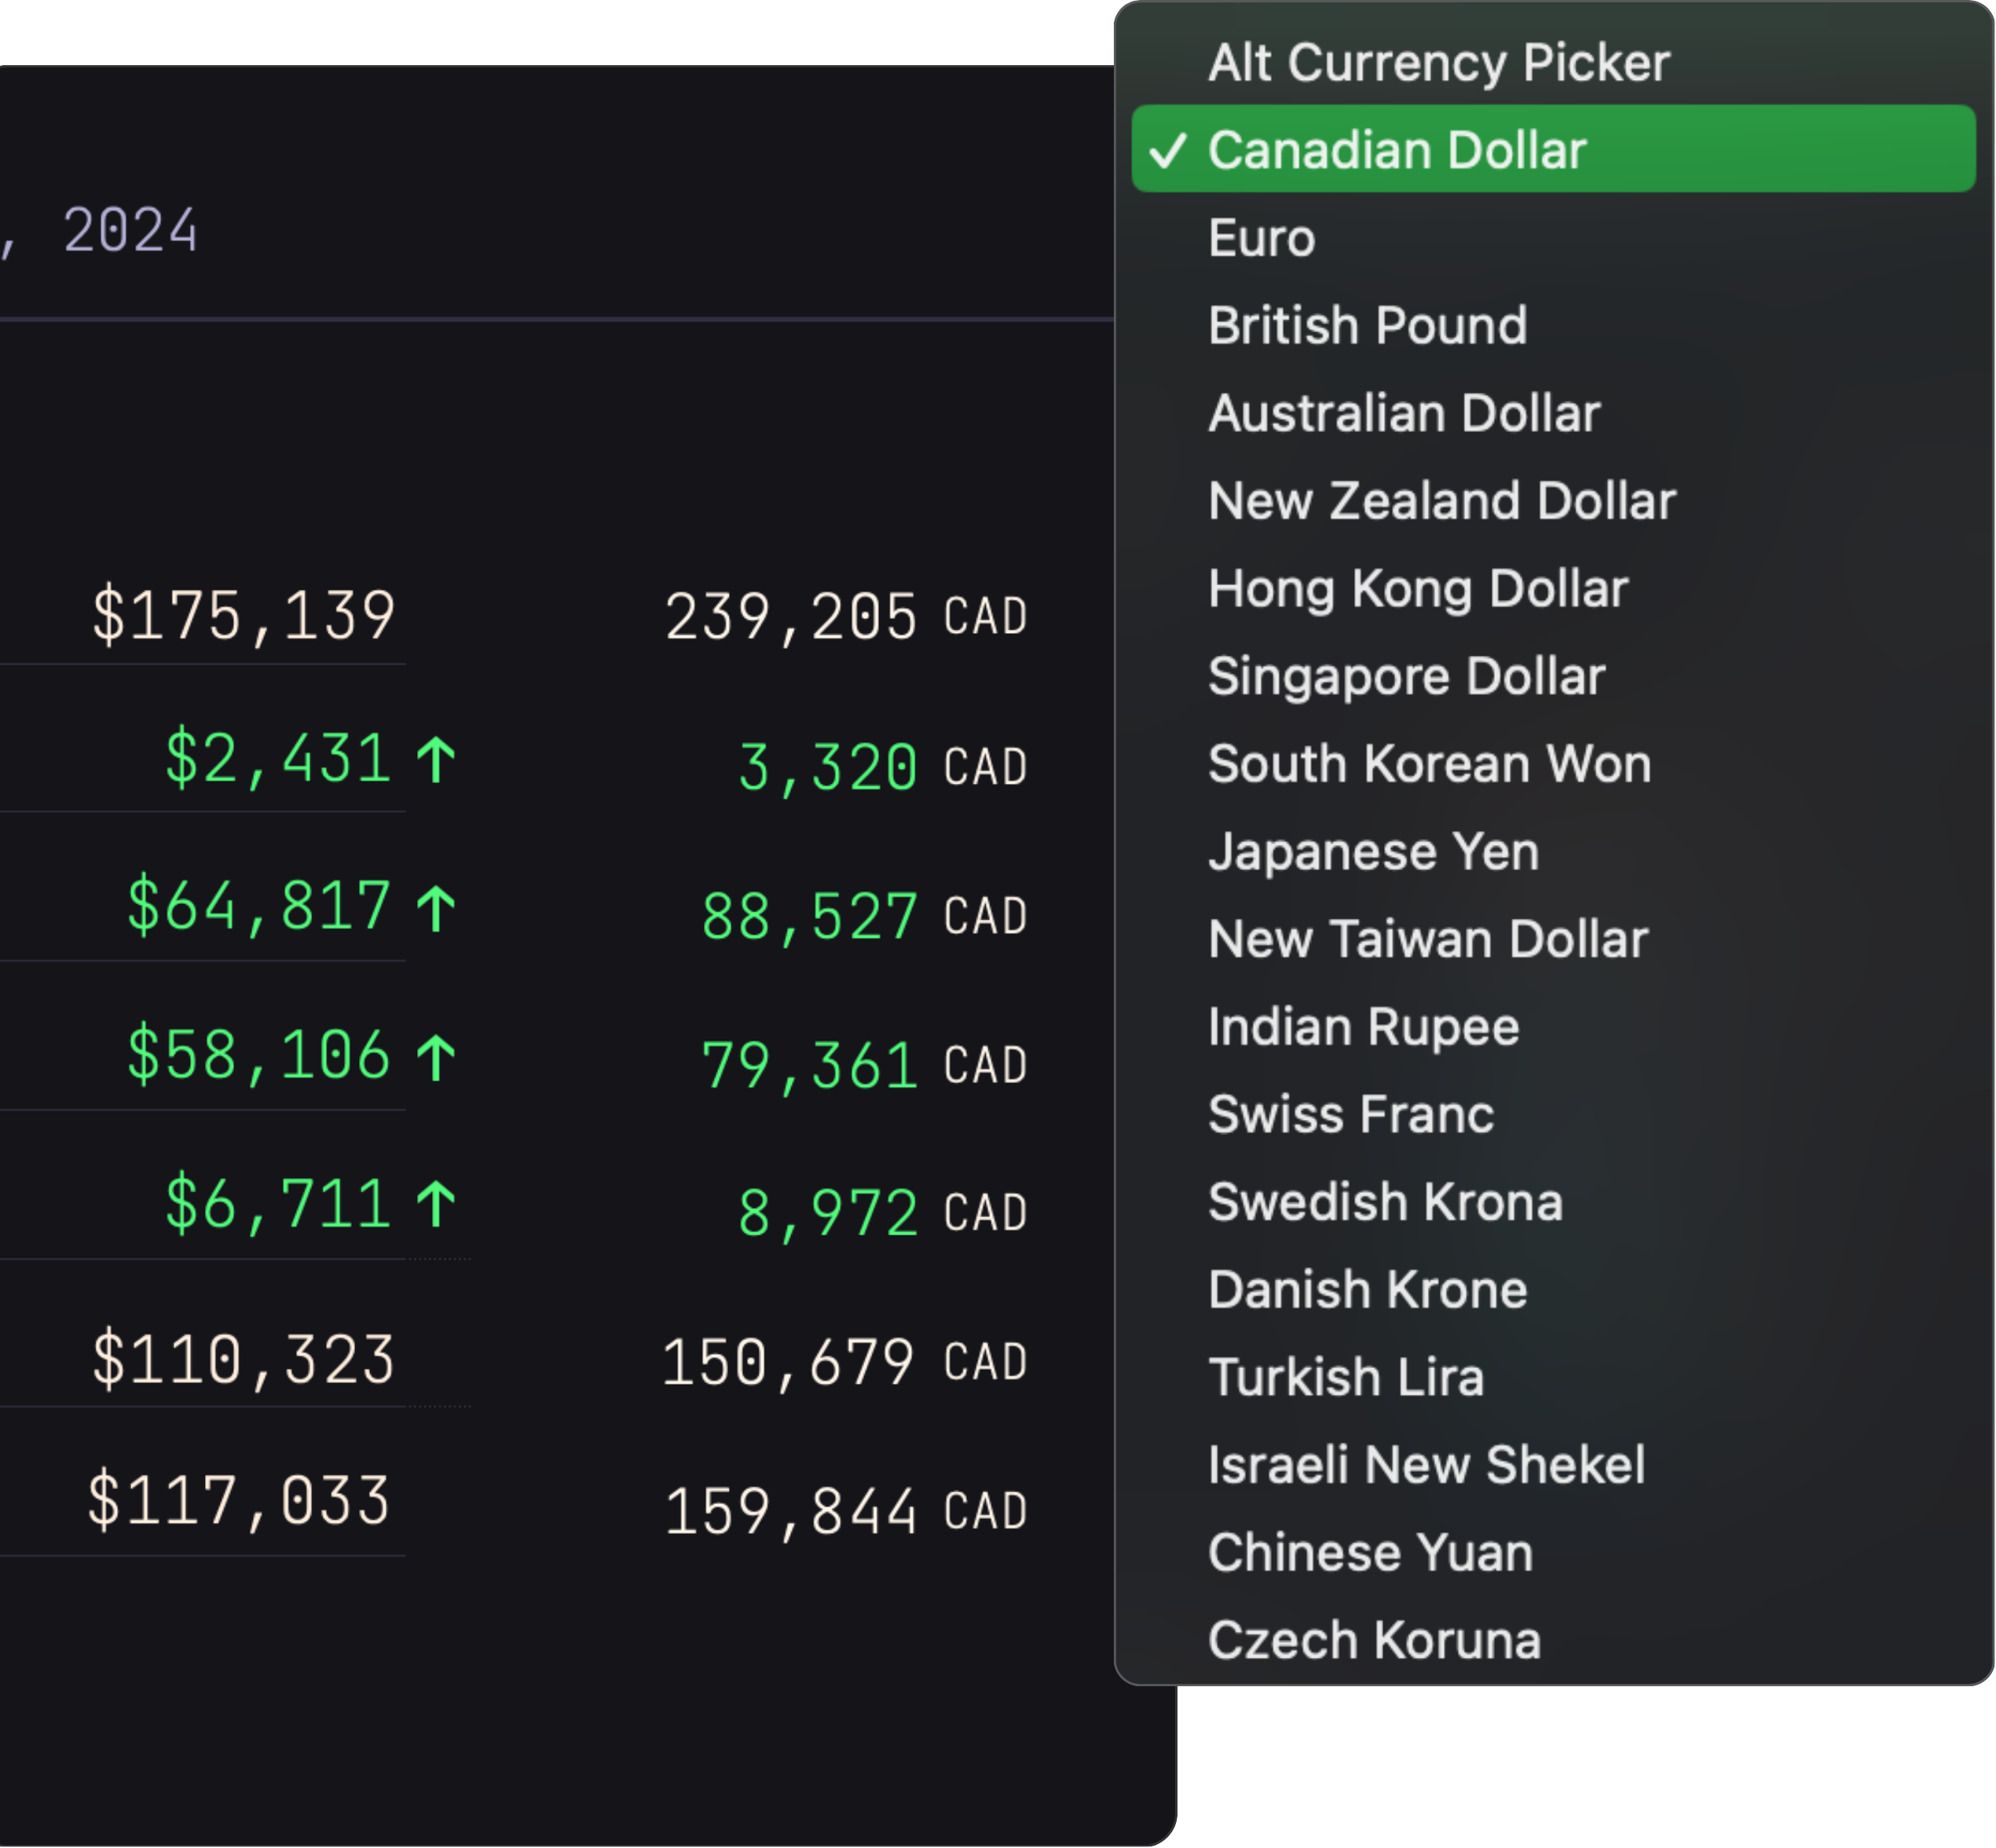
In the very top right corner is the secondary currency selection tool. By default this will be set to "none". If you wish to set a secondary currency, you can[ find out how here](/1/tracker/secondary-currency).&#x20;

<figure><img src="/files/QNi2F8gqIC3RNUHnyfrw" alt="Secondary Currency Selection Tool"><figcaption><p>Secondary Currency Selection Tool</p></figcaption></figure>

### P\&L Widgets

<figure><img src="/files/cryntDcNEmH2Alz7tVCN" alt="Investment Tracker – Premium Templates for Apple Numbers."><figcaption><p>Visual P&#x26;L</p></figcaption></figure>

#### Unrealized % P\&L by Asset

This widget allows you to monitor the current **unrealized % profits and losses** on your assets visually.  This takes into account all your accounts (portfolio-wide).

This is useful to see at a glimpse when it’s time to take profit or cut your losses and to quickly see where you stand with each of your current holdings.

#### All-Time $ P\&L by Asset

This widget allows you to monitor your all-time **dollar amount profits and losses** on your assets visually.  This amount is the addition of your realized P\&L and your unrealized P\&L for each asset.

&#x20;This takes into account all your accounts (portfolio-wide).

## Portfolio Breakdown

<figure><img src="/files/LN8YxMqlI4xd946ga1Zb" alt="Portfolio Tracker – Premium Templates for Apple Numbers."><figcaption><p>Portfolio Breakdown</p></figcaption></figure>

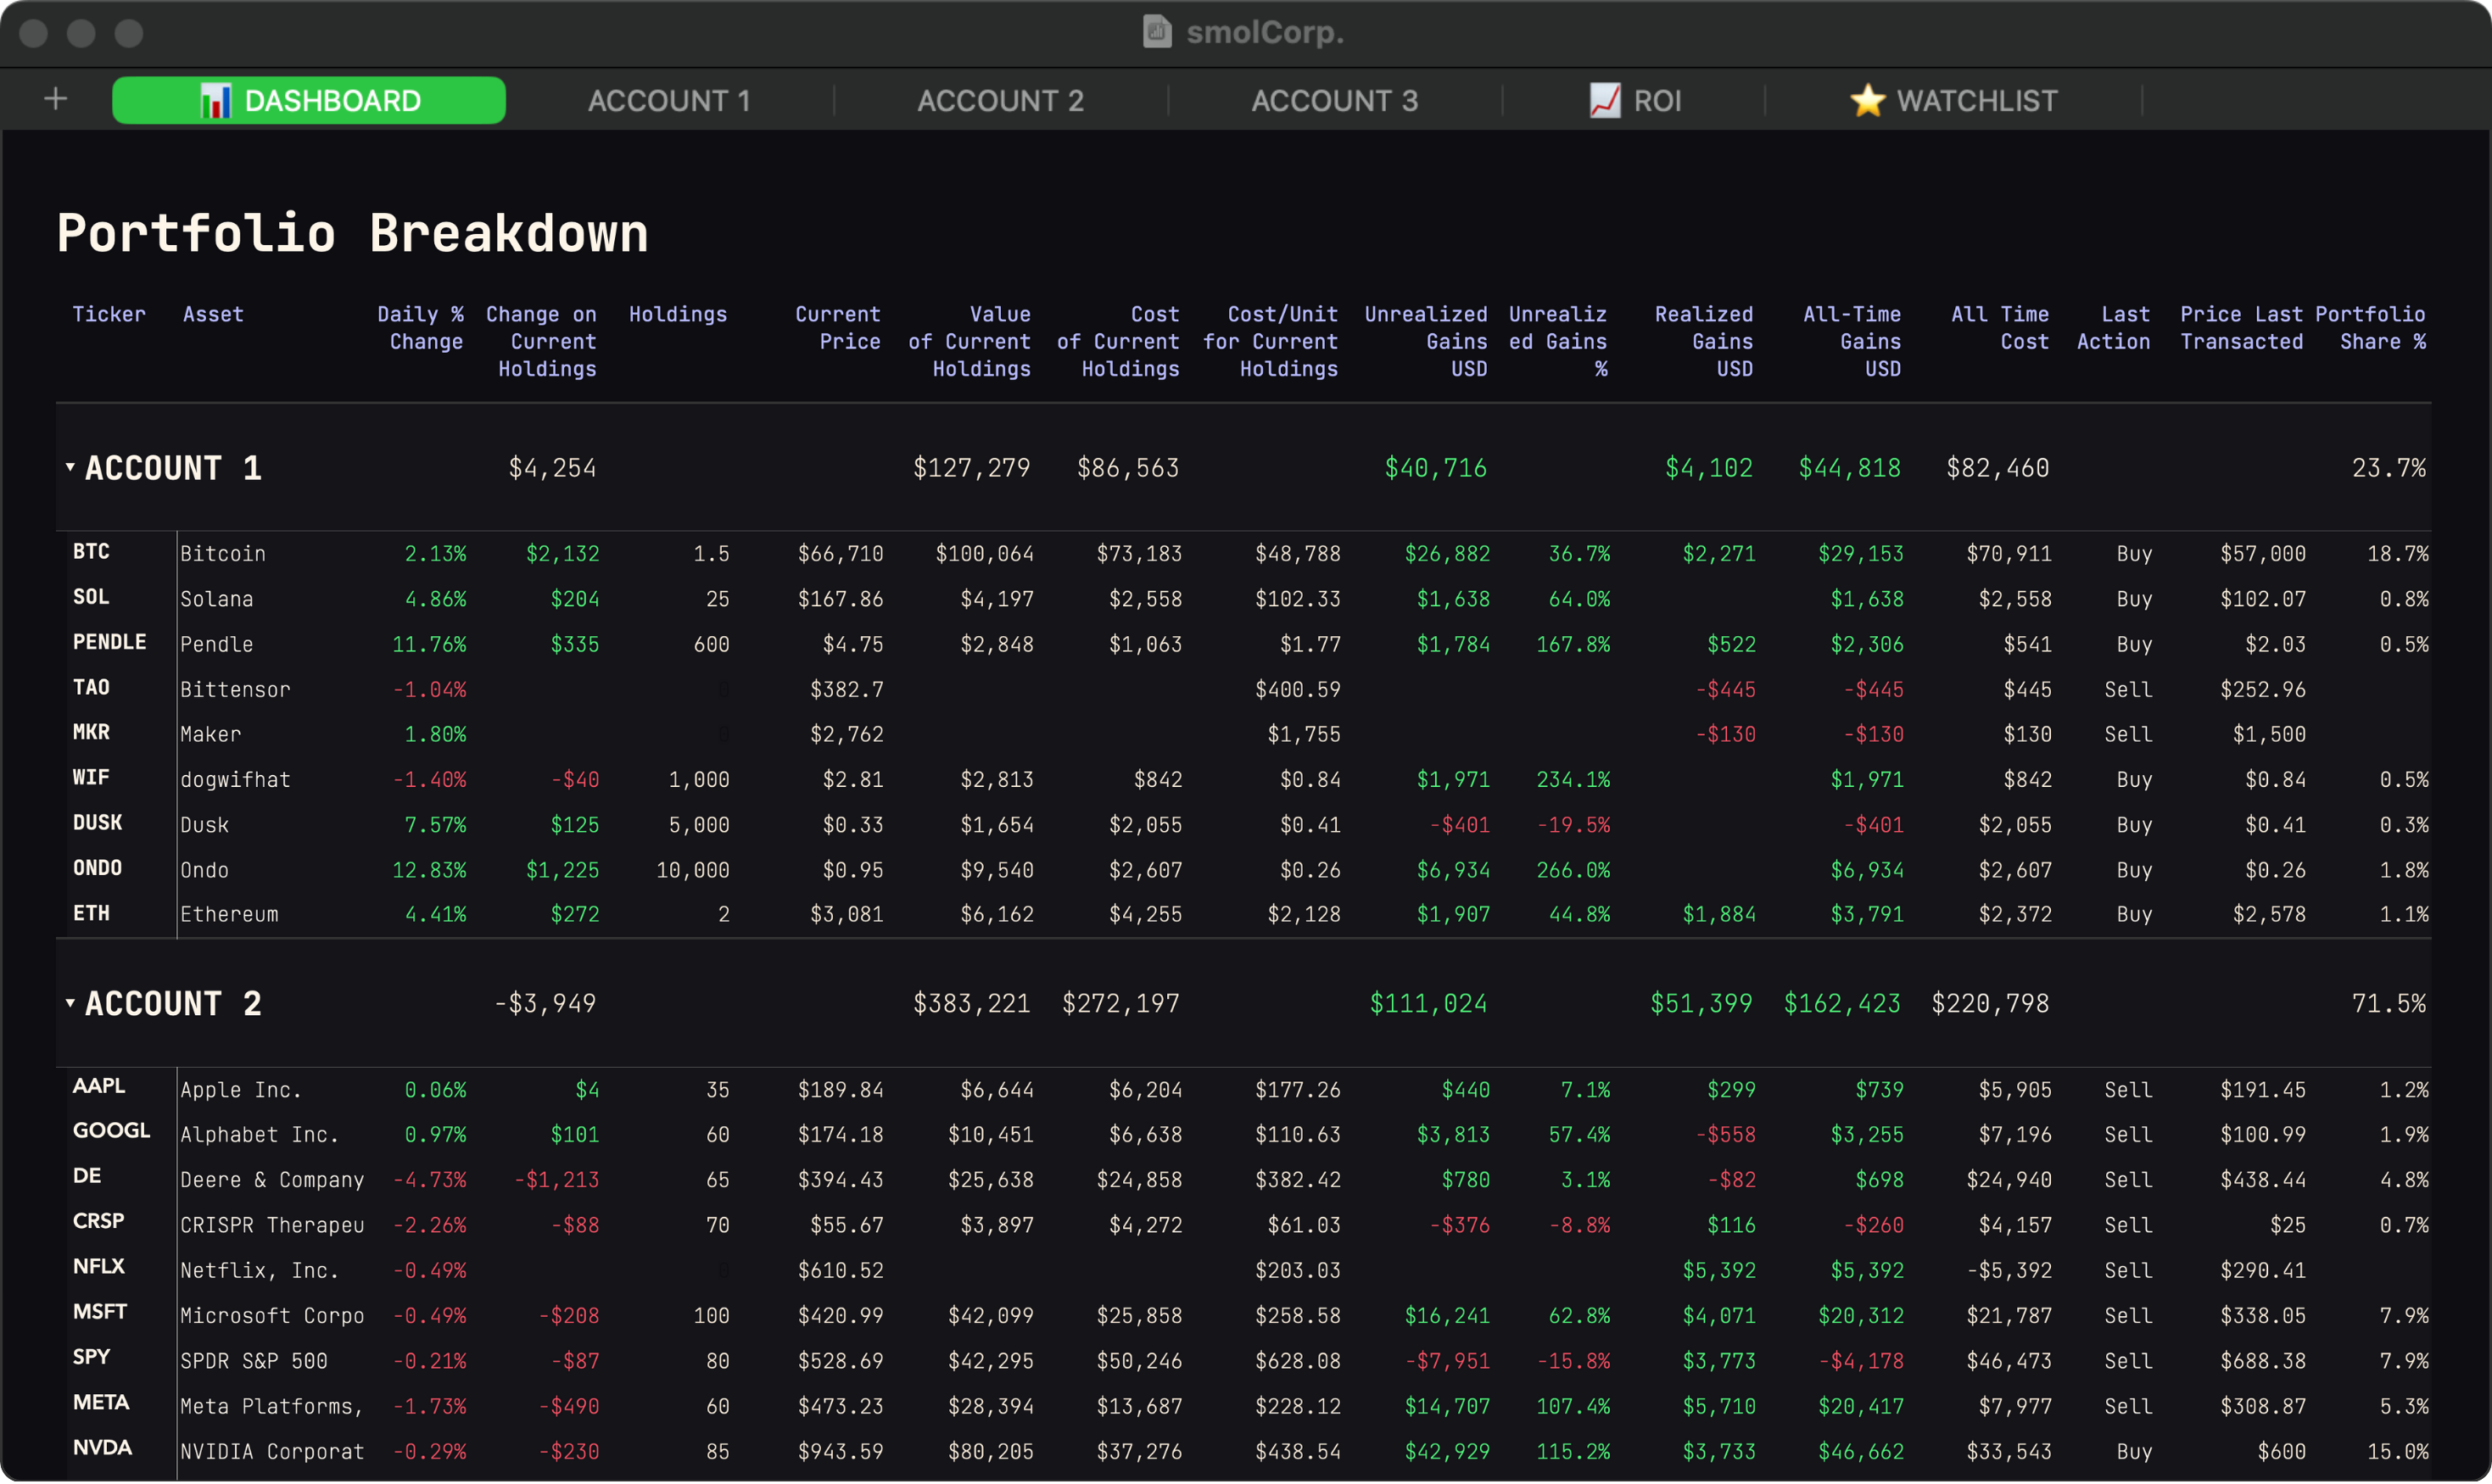
The Portfolio Breakdown is similar to the Holdings tables in your accounts but with the key differences that it displays stats for assets across all your accounts and that it is fully *sortable by headers*.&#x20;

The Breakdown table will self-populate. New rows will be added automatically when new assets are added to the Trade Log of each of your accounts.

You can change your accounts' names to something more descriptive by clicking in the cells where it says "ACCOUNT 1", "ACCOUNT 2", "ACCOUNT 3", and changing those names.  You can then rename the Account sheets to match these names.&#x20;

You can also ***sort*** the Portfolio Breakdown by one of the many metrics it presents. To do so, simply click on the small arrow next to the letter identifying the column and select either "Sort Ascending" or "Sort Descending".

<figure><img src="/files/nZgt9vNgLKQDjM8psIda" alt="Sorting your portfolio&#x27;s asset Breakdown"><figcaption><p>Sorting your portfolio's asset Breakdown</p></figcaption></figure>

#### Available Metrics:

* **Ticker** (The asset codes you've entered in the [**Trade Log**](/1/tracker/accounts#trade-log))
* **Asset's name.**
* **Daily % Change** in price of the asset.
* **$ Change on Current Holdings**
* **Holdings** (number of units currently owned for each asset).
* **Current Price** of the asset.
* The **current value** of your holdings of this asset.&#x20;
* The tota**l cost of your&#x20;*****current holdings*** for the asset (similar to 6.)
* **Cost / Unit** (The total cost of your *current holdings* of the asset divided by the number of units *currently owned.* This is your current cost basis per unit.&#x20;
* **$  Unrealized Gains** on your *current holdings* of the asset.&#x20;
* **% Unrealized Gains** on your *current holdings* of the asset.&#x20;
* **$  Realized Gains or losses** for this asset.&#x20;
* **$ All-Time Gains** for this asset.
* **$ All-Time Cost** for this asset.&#x20;
* Whether your **last transaction** of this asset was a BUY or a SELL.&#x20;
* The **price at which you last transacted** this asset.&#x20;
* **% Share** (Allocation) of your total portfolio your holdings of this asset represents.&#x20;
* The **amount of realized gains or losses** for this asset in the [secondary currency you have selected](#secondary-currency-selection-tool).  This number takes into account the *exchange rate for* the selected currency against the US dollar *on the date of each realized event* in order to give you the most accurate amount possible. This is especially relevant for tax purposes.


# ROI Charts

How to use the ROI Tool

Whereas [**Accounts** ](/1/tracker/accounts)are self-contained and fully independent (mini portfolio trackers all to themselves), the **ROI tool** pulls data from all your accounts to display your ROI[^1] across your entire portfolio.&#x20;

The ROI tool aggregates the data from the [**Snapshots**](/1/tracker/accounts#snapshots) you take in your accounts and plots this data on charts, each giving you a different representation of your portfolio's performance over time.&#x20;

In addition, the ROI tool plots the performance of important benchmarks so you can compare your portfolio's performance against them. You can even add custom benchmarks to some of the charts.&#x20;

Here's an overview of each chart:

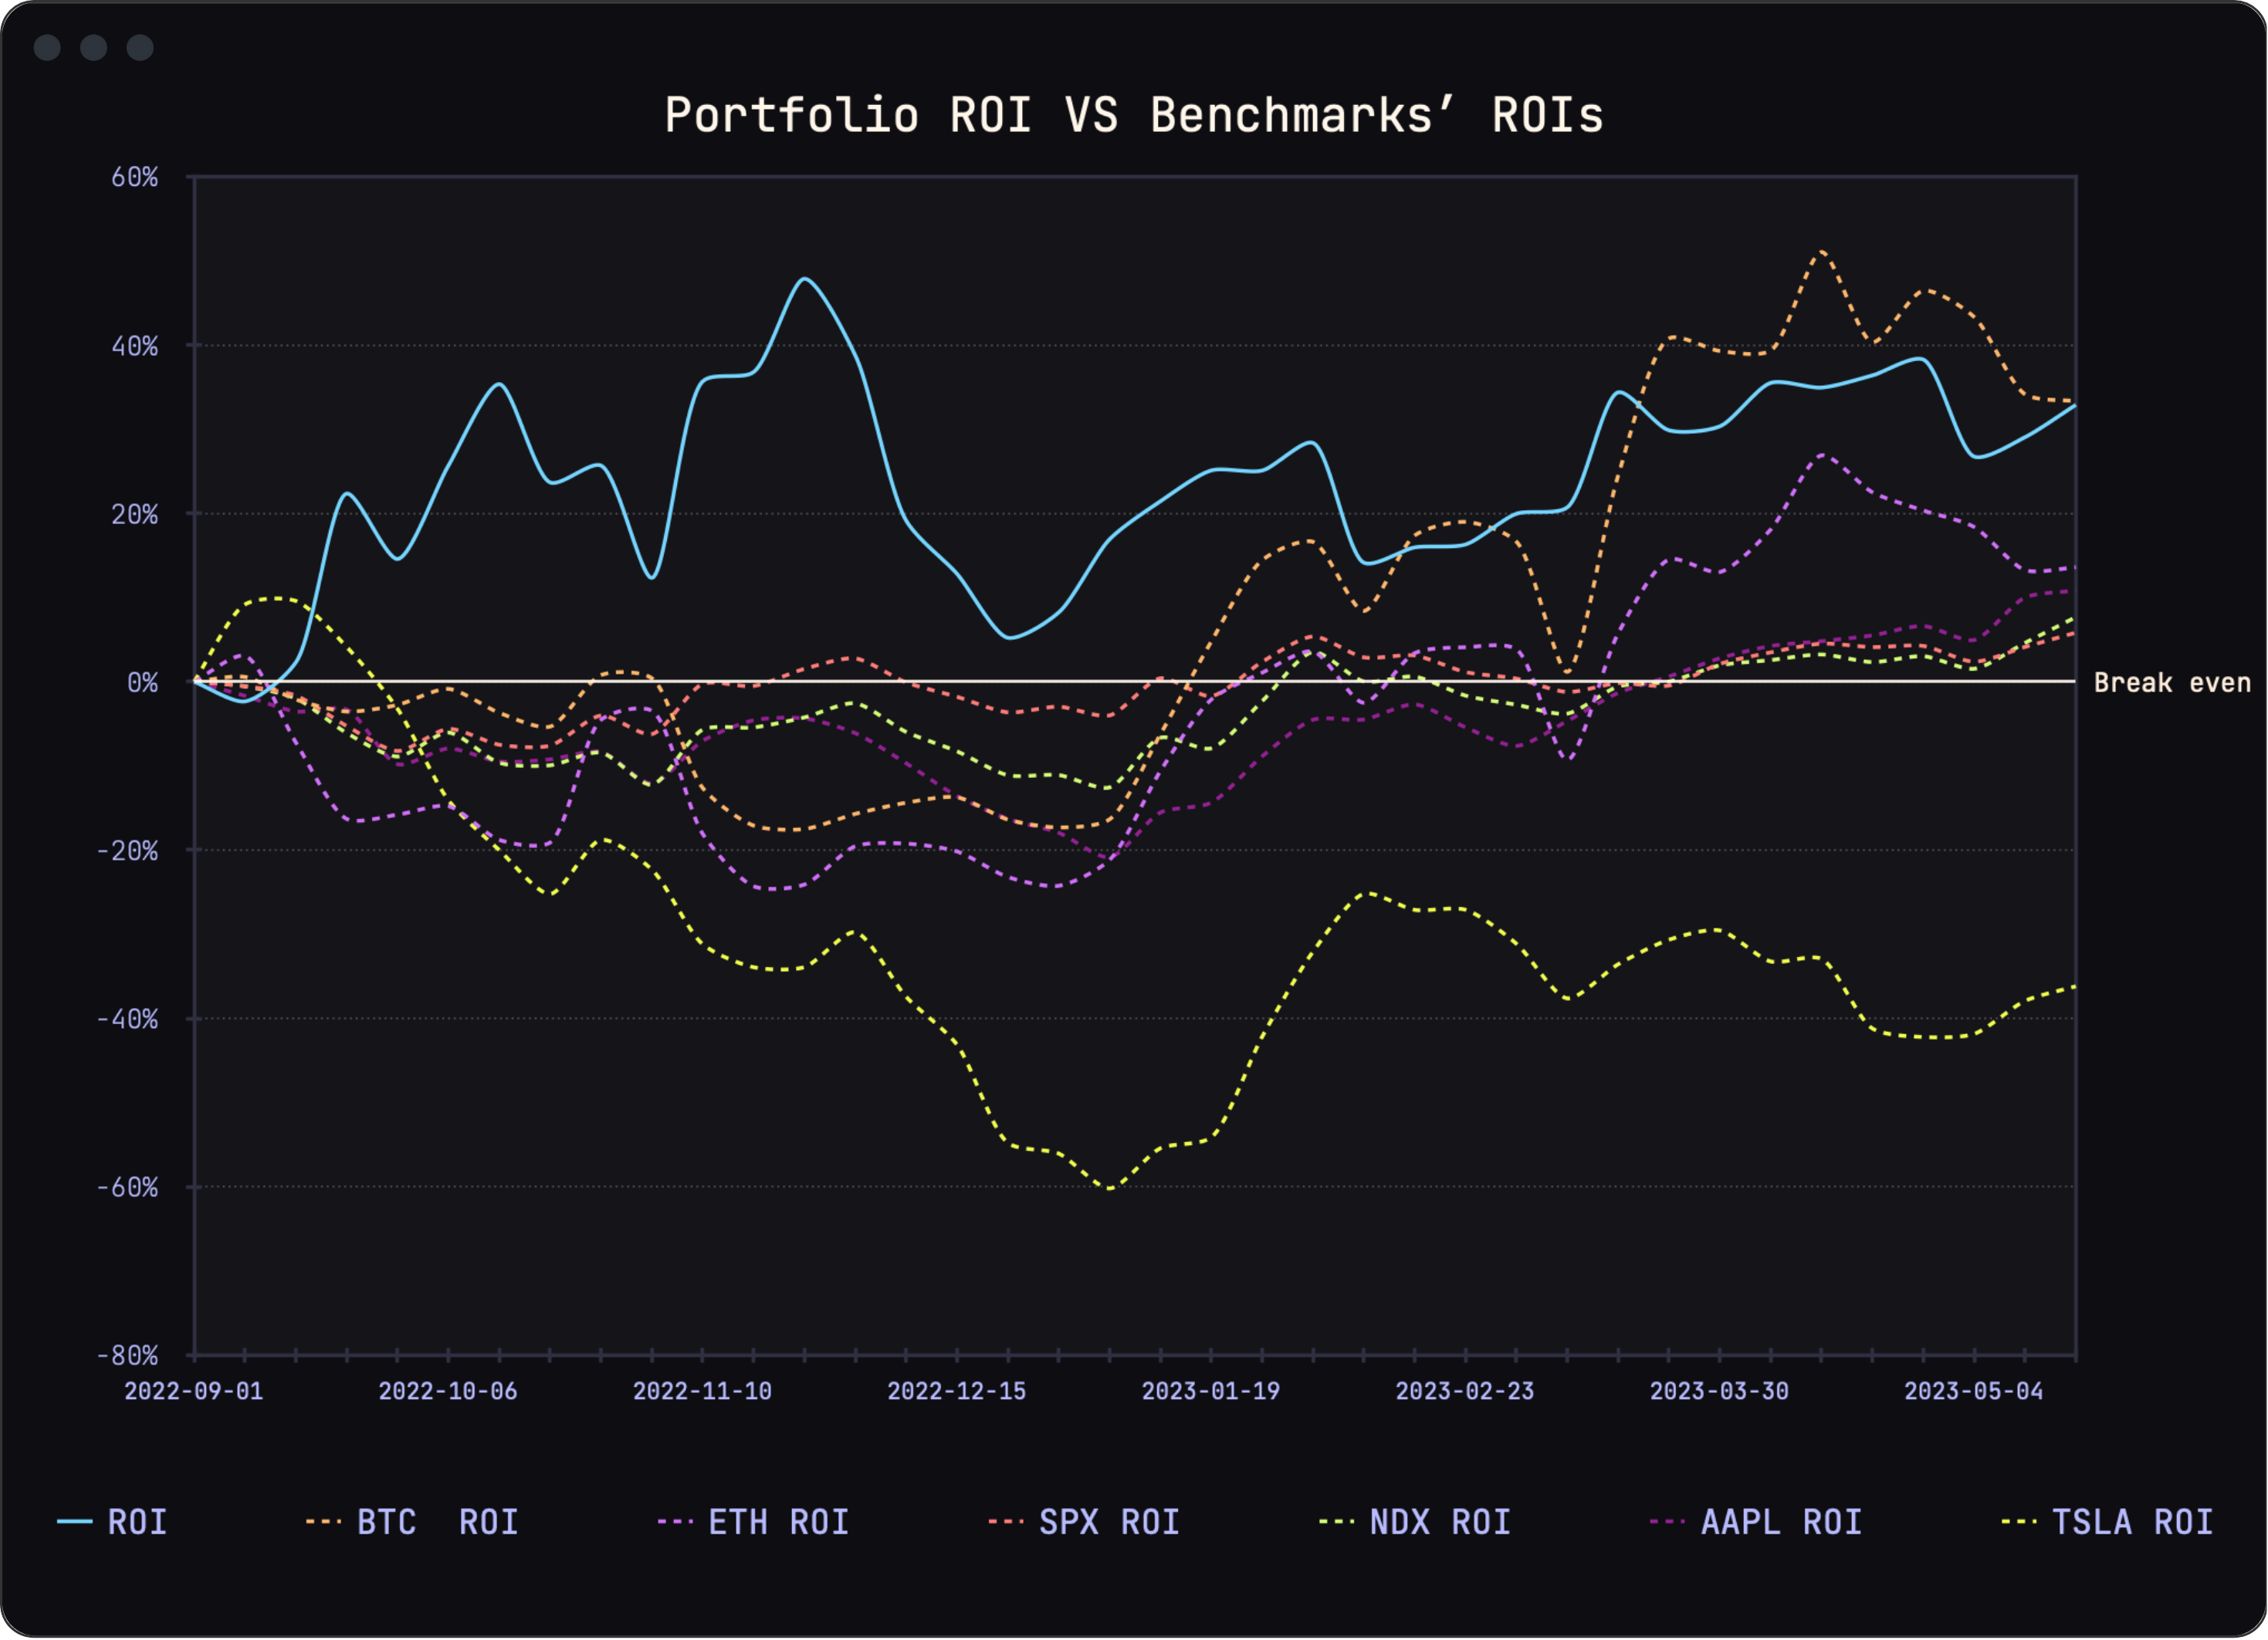
## Portfolio ROI VS Benchmarks' ROI

<figure><img src="/files/X3UQgnkIAk4qWHn7pMve" alt="Portfolio Tracker – Premium Templates for Apple Numbers."><figcaption><p>Portfolio VS Benchmarks</p></figcaption></figure>

This chart plots your portfolio’s ROI (in dollar terms) and compares it to the ROI of benchmarks of your choosing.&#x20;

To toggle on and off a benchmark's line on the chart, simply check or uncheck the checkbox next to the name of the benchmark.&#x20;

<figure><img src="/files/G5es2zSHvPvpR5zBz8iL" alt="" width="375"><figcaption><p>Toggling benchmarks on and off</p></figcaption></figure>

You change the custom benchmarks by entering different tickers in the lighter cells. To add indices as custom benchmarks, enter the ticker of an ETF that tracks the desired index ([SPDR  ETFs](https://www.sectorspdrs.com/) are a great option).&#x20;

<figure><img src="/files/nbRDHYskQOI1kCffaXjs" alt="Adding a custom benchmark"><figcaption><p>Adding NVDA as a custom benchmark</p></figcaption></figure>

## Portfolio ROI (against USD, BTC & ETH)

<figure><img src="/files/wYpyyOFJMDVUUCB6hmQr" alt="Portfolio Tracker – Premium Templates for Apple Numbers."><figcaption><p>Portfolio's ROI VS USD, BTC, &#x26; ETH Chart</p></figcaption></figure>

This chart plots your portfolio’s ROI against the US dollar (like the first chart) and compares it to  your portfolio’s ROI against BTC and against ETH.&#x20;

This is done by tracking the cost of your portfolio in BTC and ETH terms (in addition to its USD cost).  When you add or remove capital to your accounts using the[ **Cost of Account**](/1/tracker/accounts#cost-of-account) tables, the smol Portfolio Tracker records these amounts in BTC and ETH terms (using the conversation rate applicable on the date of these events), in addition to the USD amounts.

{% hint style="info" %}
**Tip:**  Tracking the ROI of your portfolio in BTC and ETH terms may be a more relevant metric if you are holding assets you consider more risky or more volatile than BTC and ETH (most ALTS for example).&#x20;

E.g., when the price of BTC goes up faster than that of your holdings, you will see your portfolio’s ROI VS BTC drop, meaning that your portfolio is currently “bleeding” against Bitcoin.&#x20;

This chart can quickly tell you if holding these riskier assets is worth it or if you would have done better simply holding Bitcoin and Ethereum.
{% endhint %}

You can toggle the BTC and ETH lines by checking or unchecking the checkboxes next to these tickers in the left-side panel.  <br>

## Portfolio’s Value in USD, BTC, & ETH Terms

<figure><img src="/files/M8Y6AahHAEzNz6t7x7z9" alt="Portfolio Tracker – Premium Templates for Apple Numbers."><figcaption><p>Portfolio's Historical Value denominated in USD, BTC, &#x26; ETH.</p></figcaption></figure>

This chart plots your portfolio’s historical value denominated in USD on the left-sided Y axis, it’s historical value denominated in ETH on the right-sided Y axis, and it’s historical value denominated in BTC on either sides, depending on which other currencies are selected.

This chart gives you yet another way to measure your portfolio's performance&#x20;

{% hint style="info" %}
**Tip:**  There will be time when your portfolio's value is going up in USD terms, but down in BTC terms. Or up in BTC terms but down in USD terms, etc. Keeping an eye on these fluctuations can be useful when trying to time big shifts in the cycle.&#x20;
{% endhint %}

You can toggle the USD, BTC and ETH lines by checking or unchecking the checkboxes next to these tickers in the left-side panel. &#x20;

If there are more charts you'd like to see added to the ROI tool, [let us know!](https://smolcompute.xyz/contact)&#x20;

[^1]: Return on investment


# Watchlists

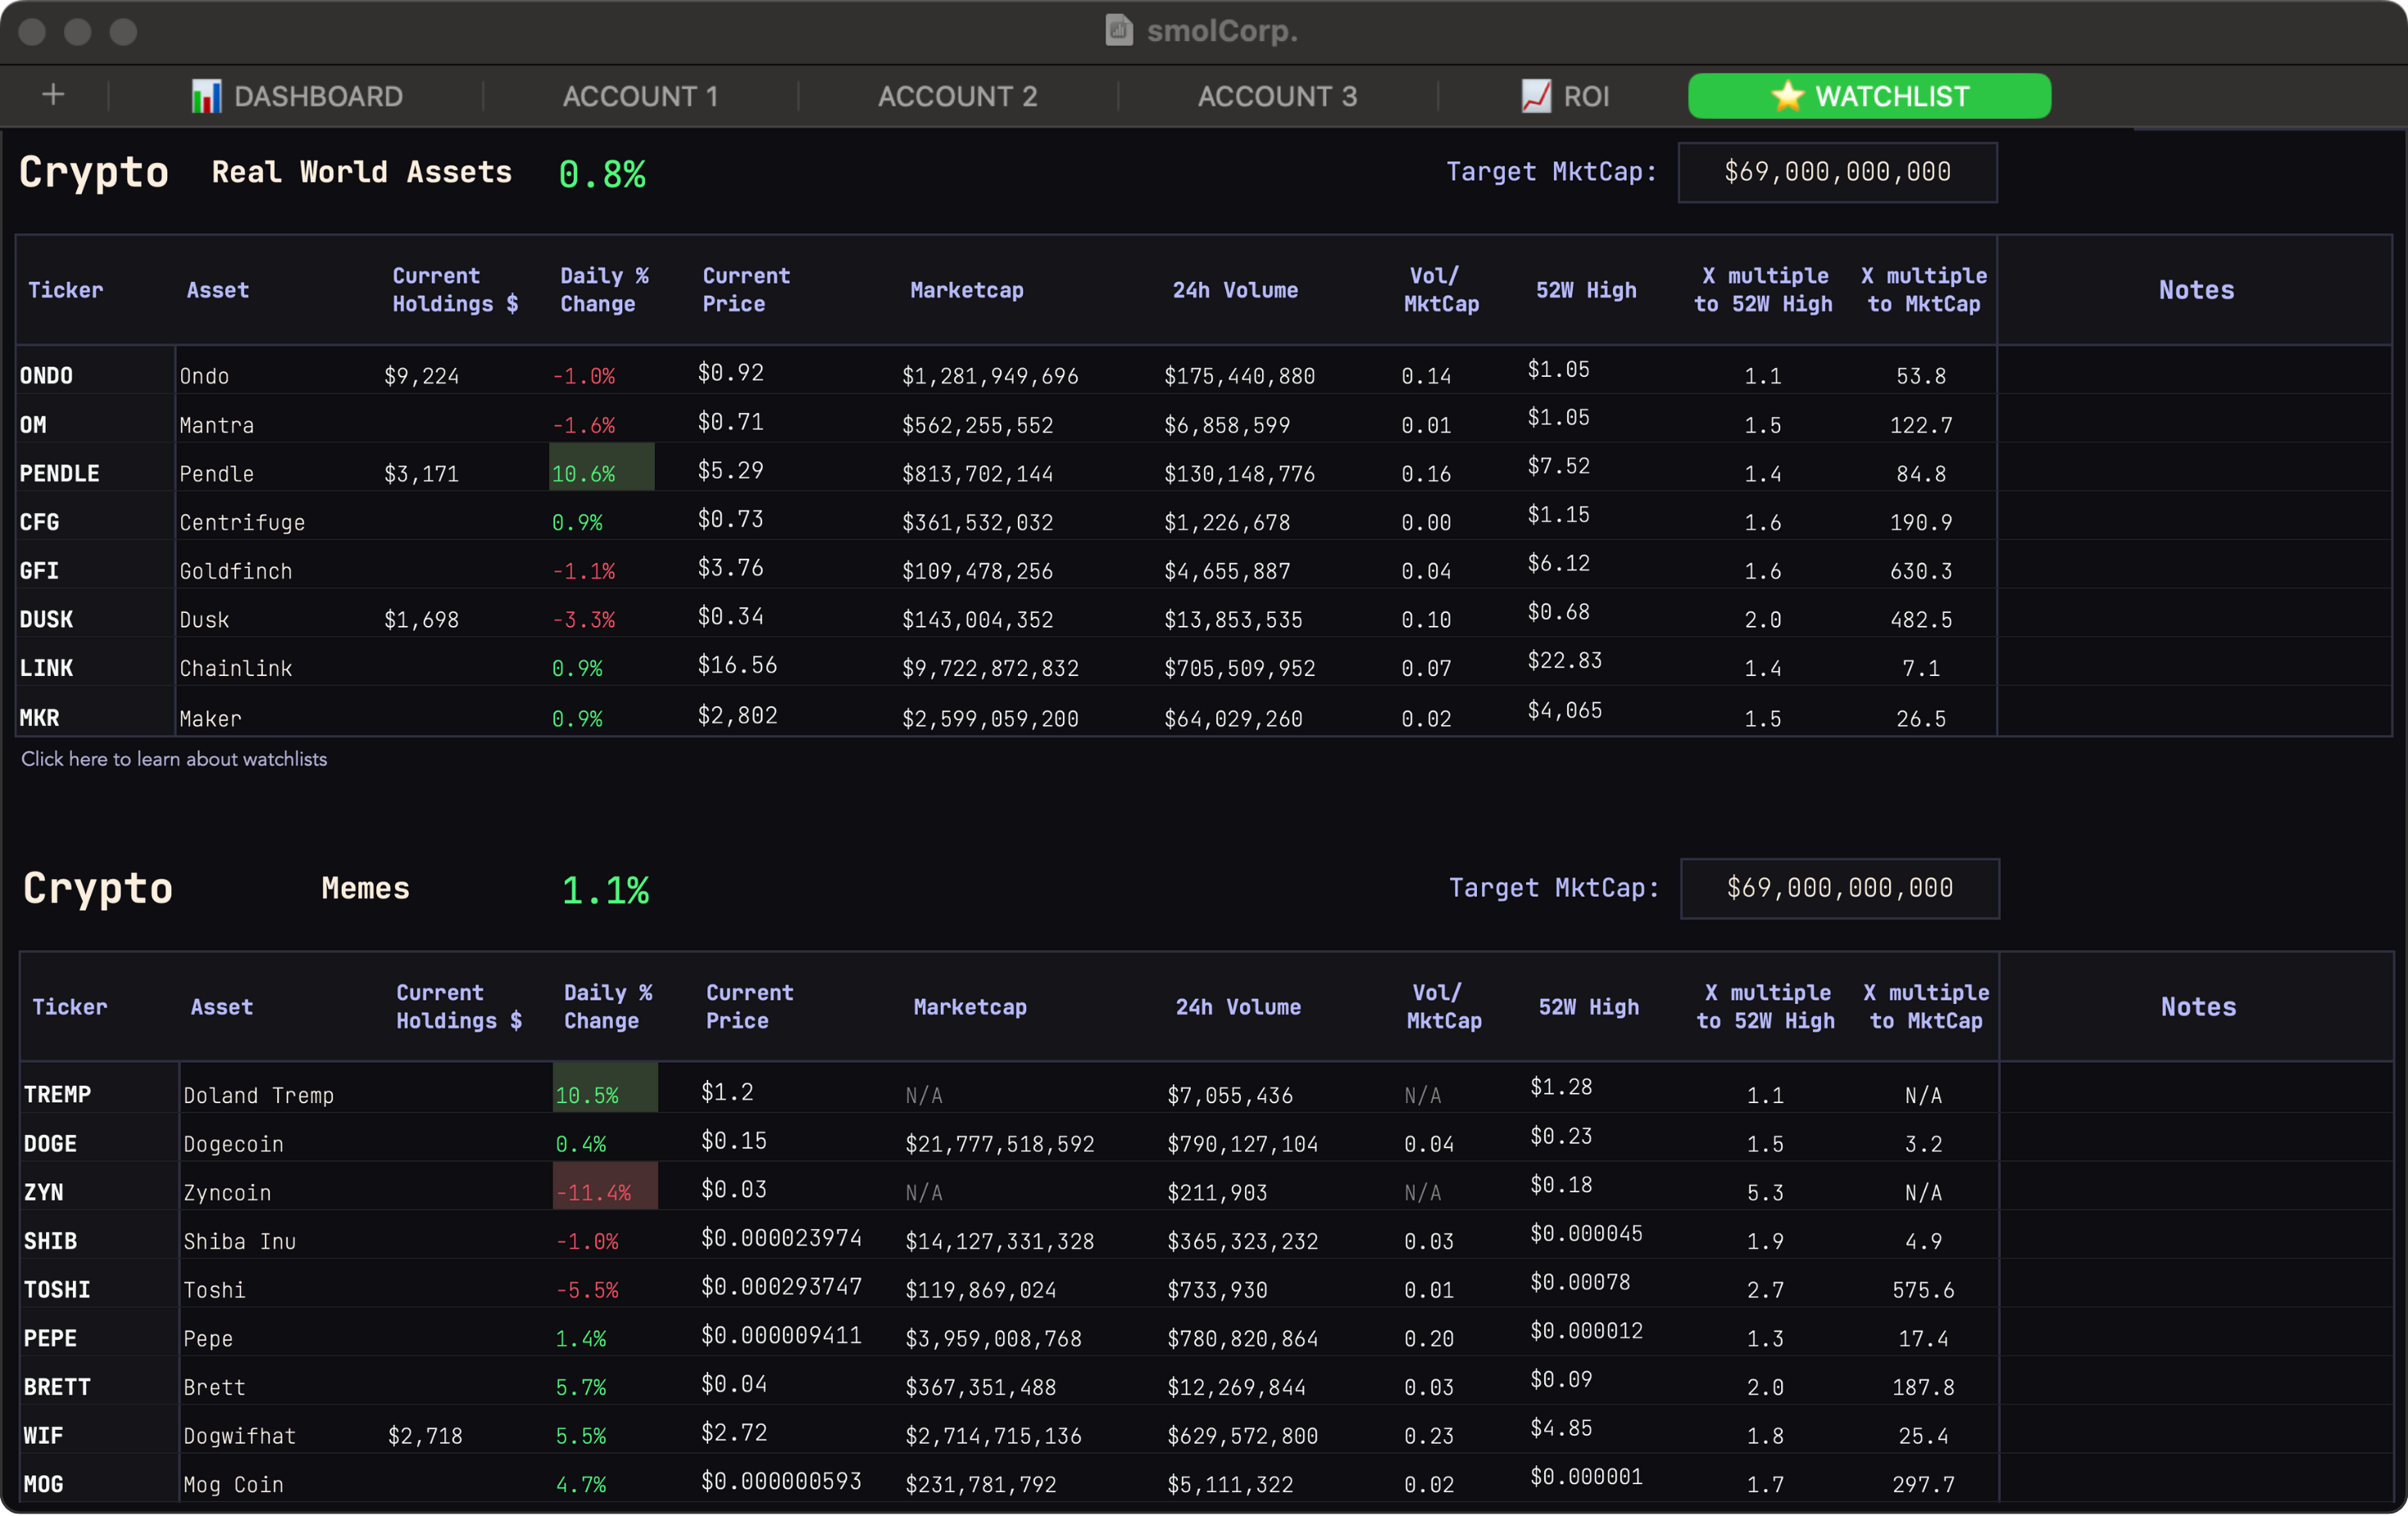
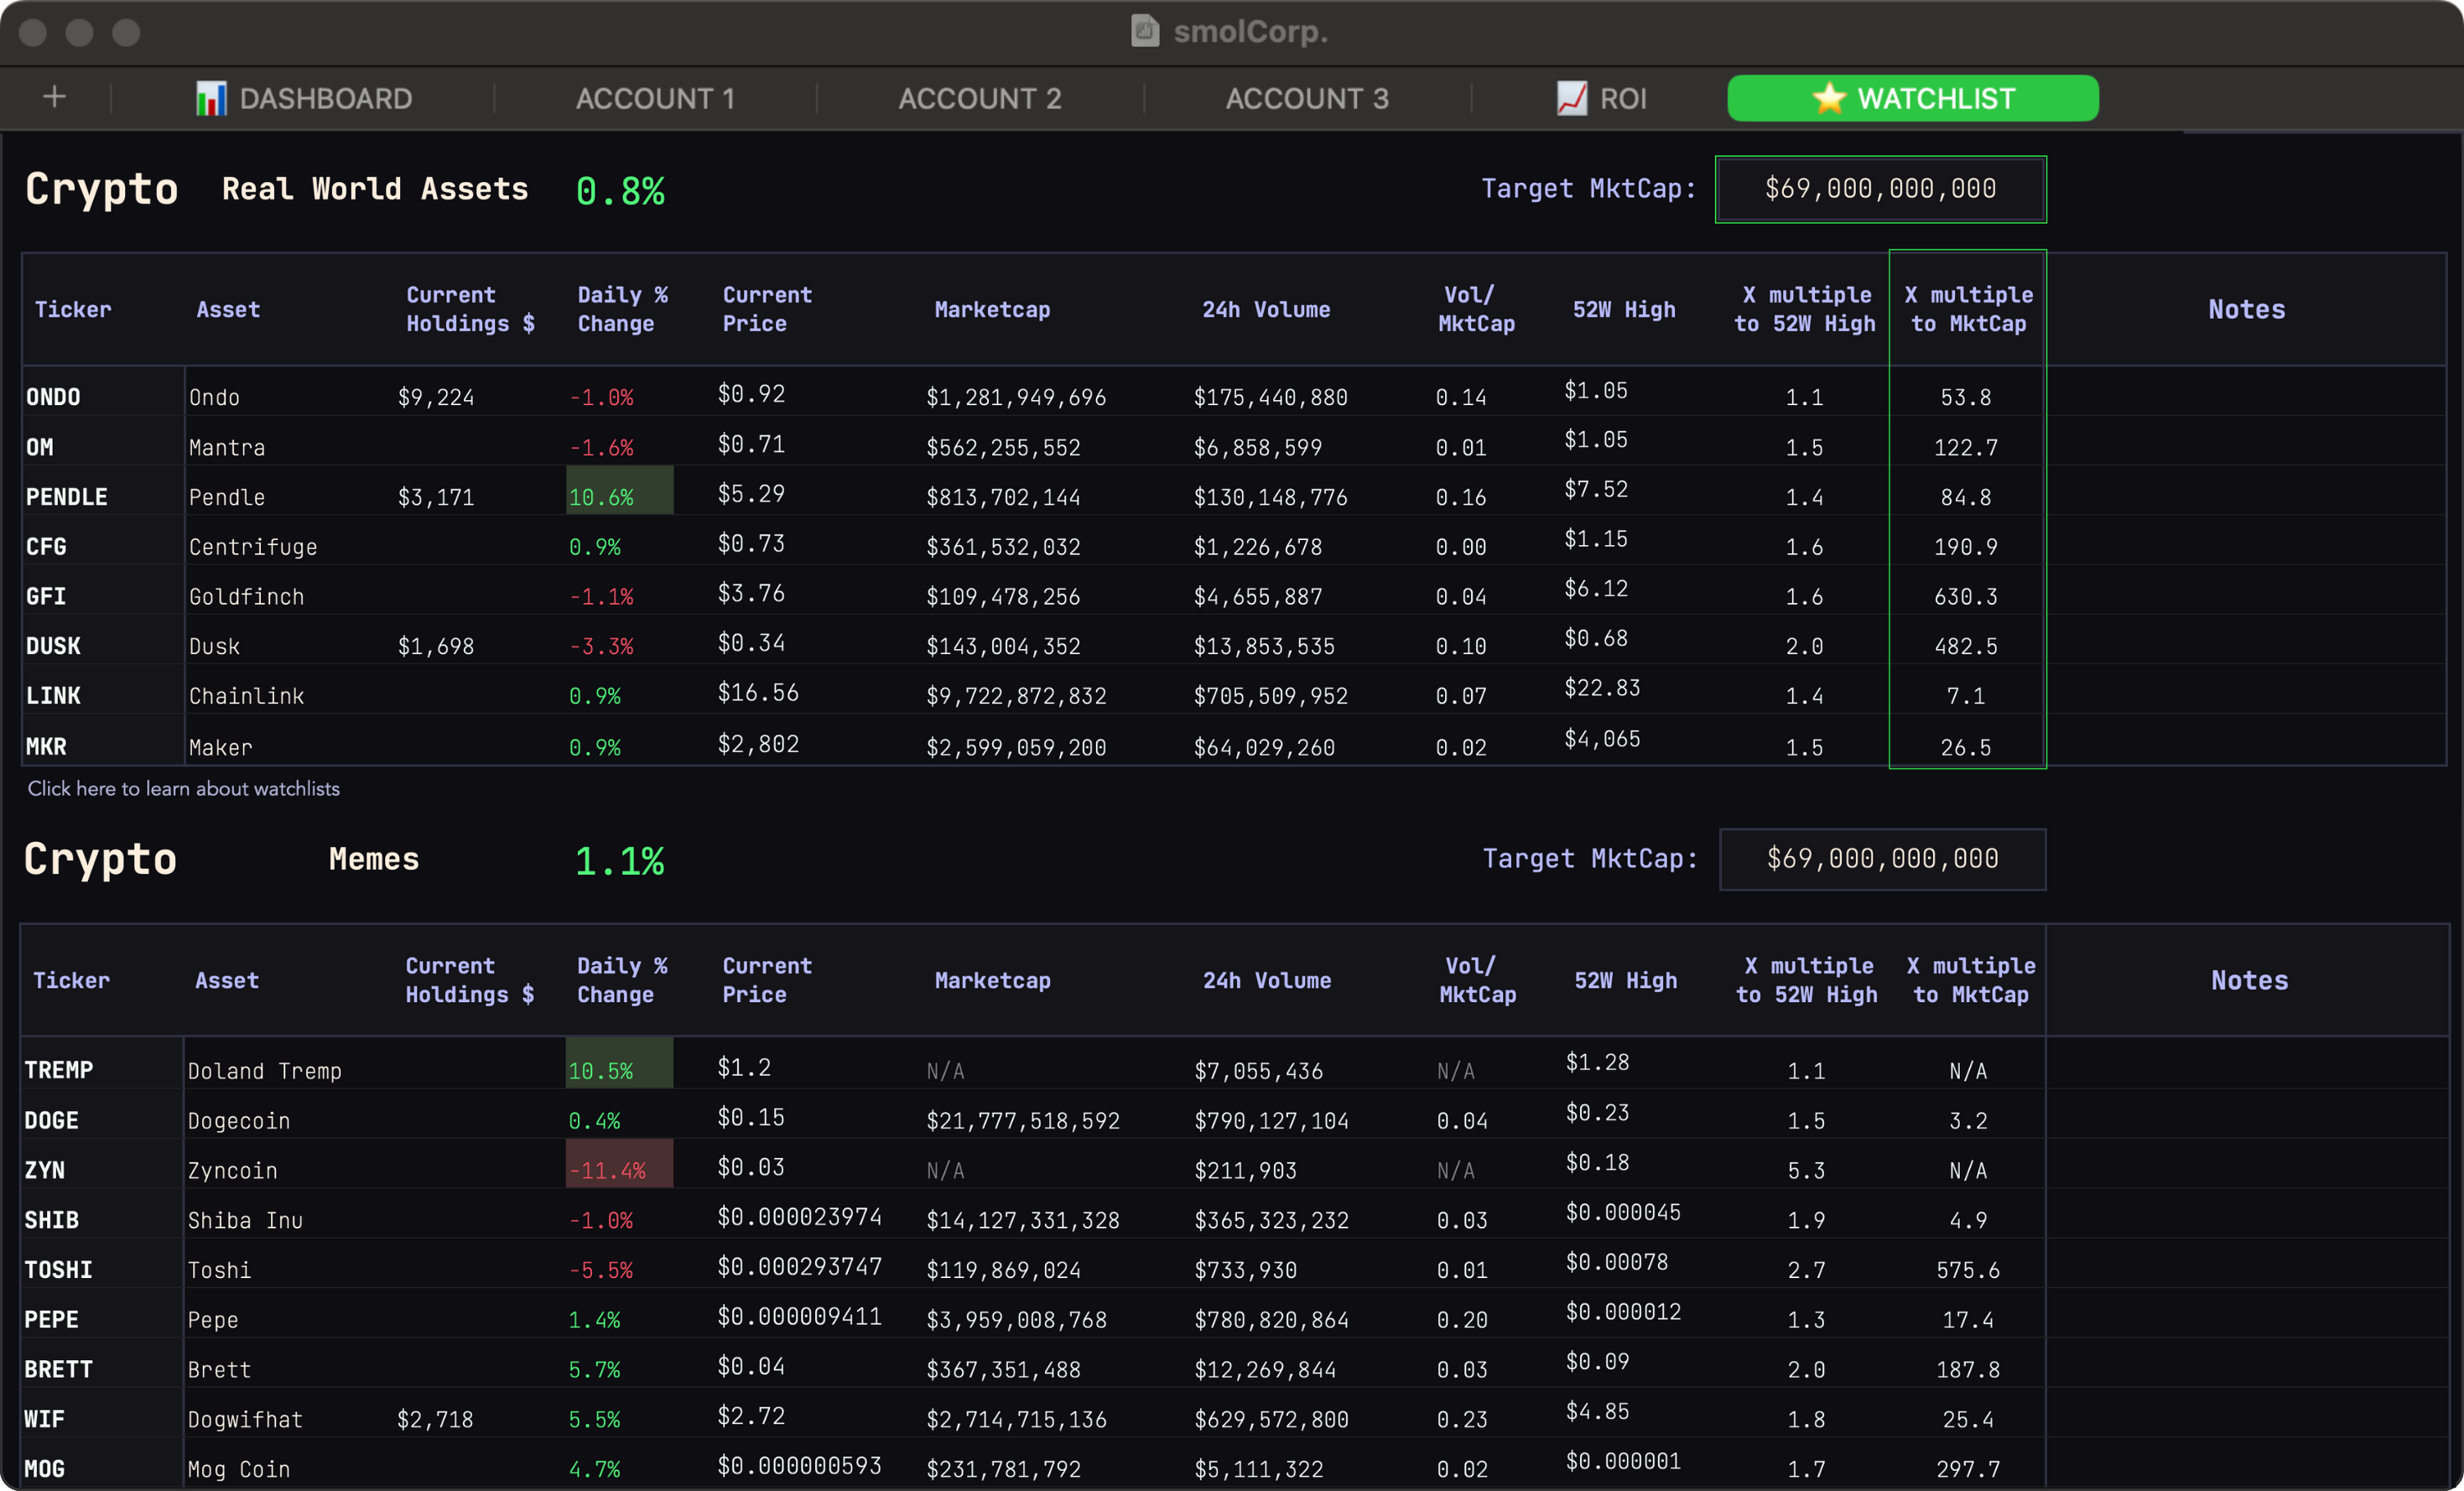
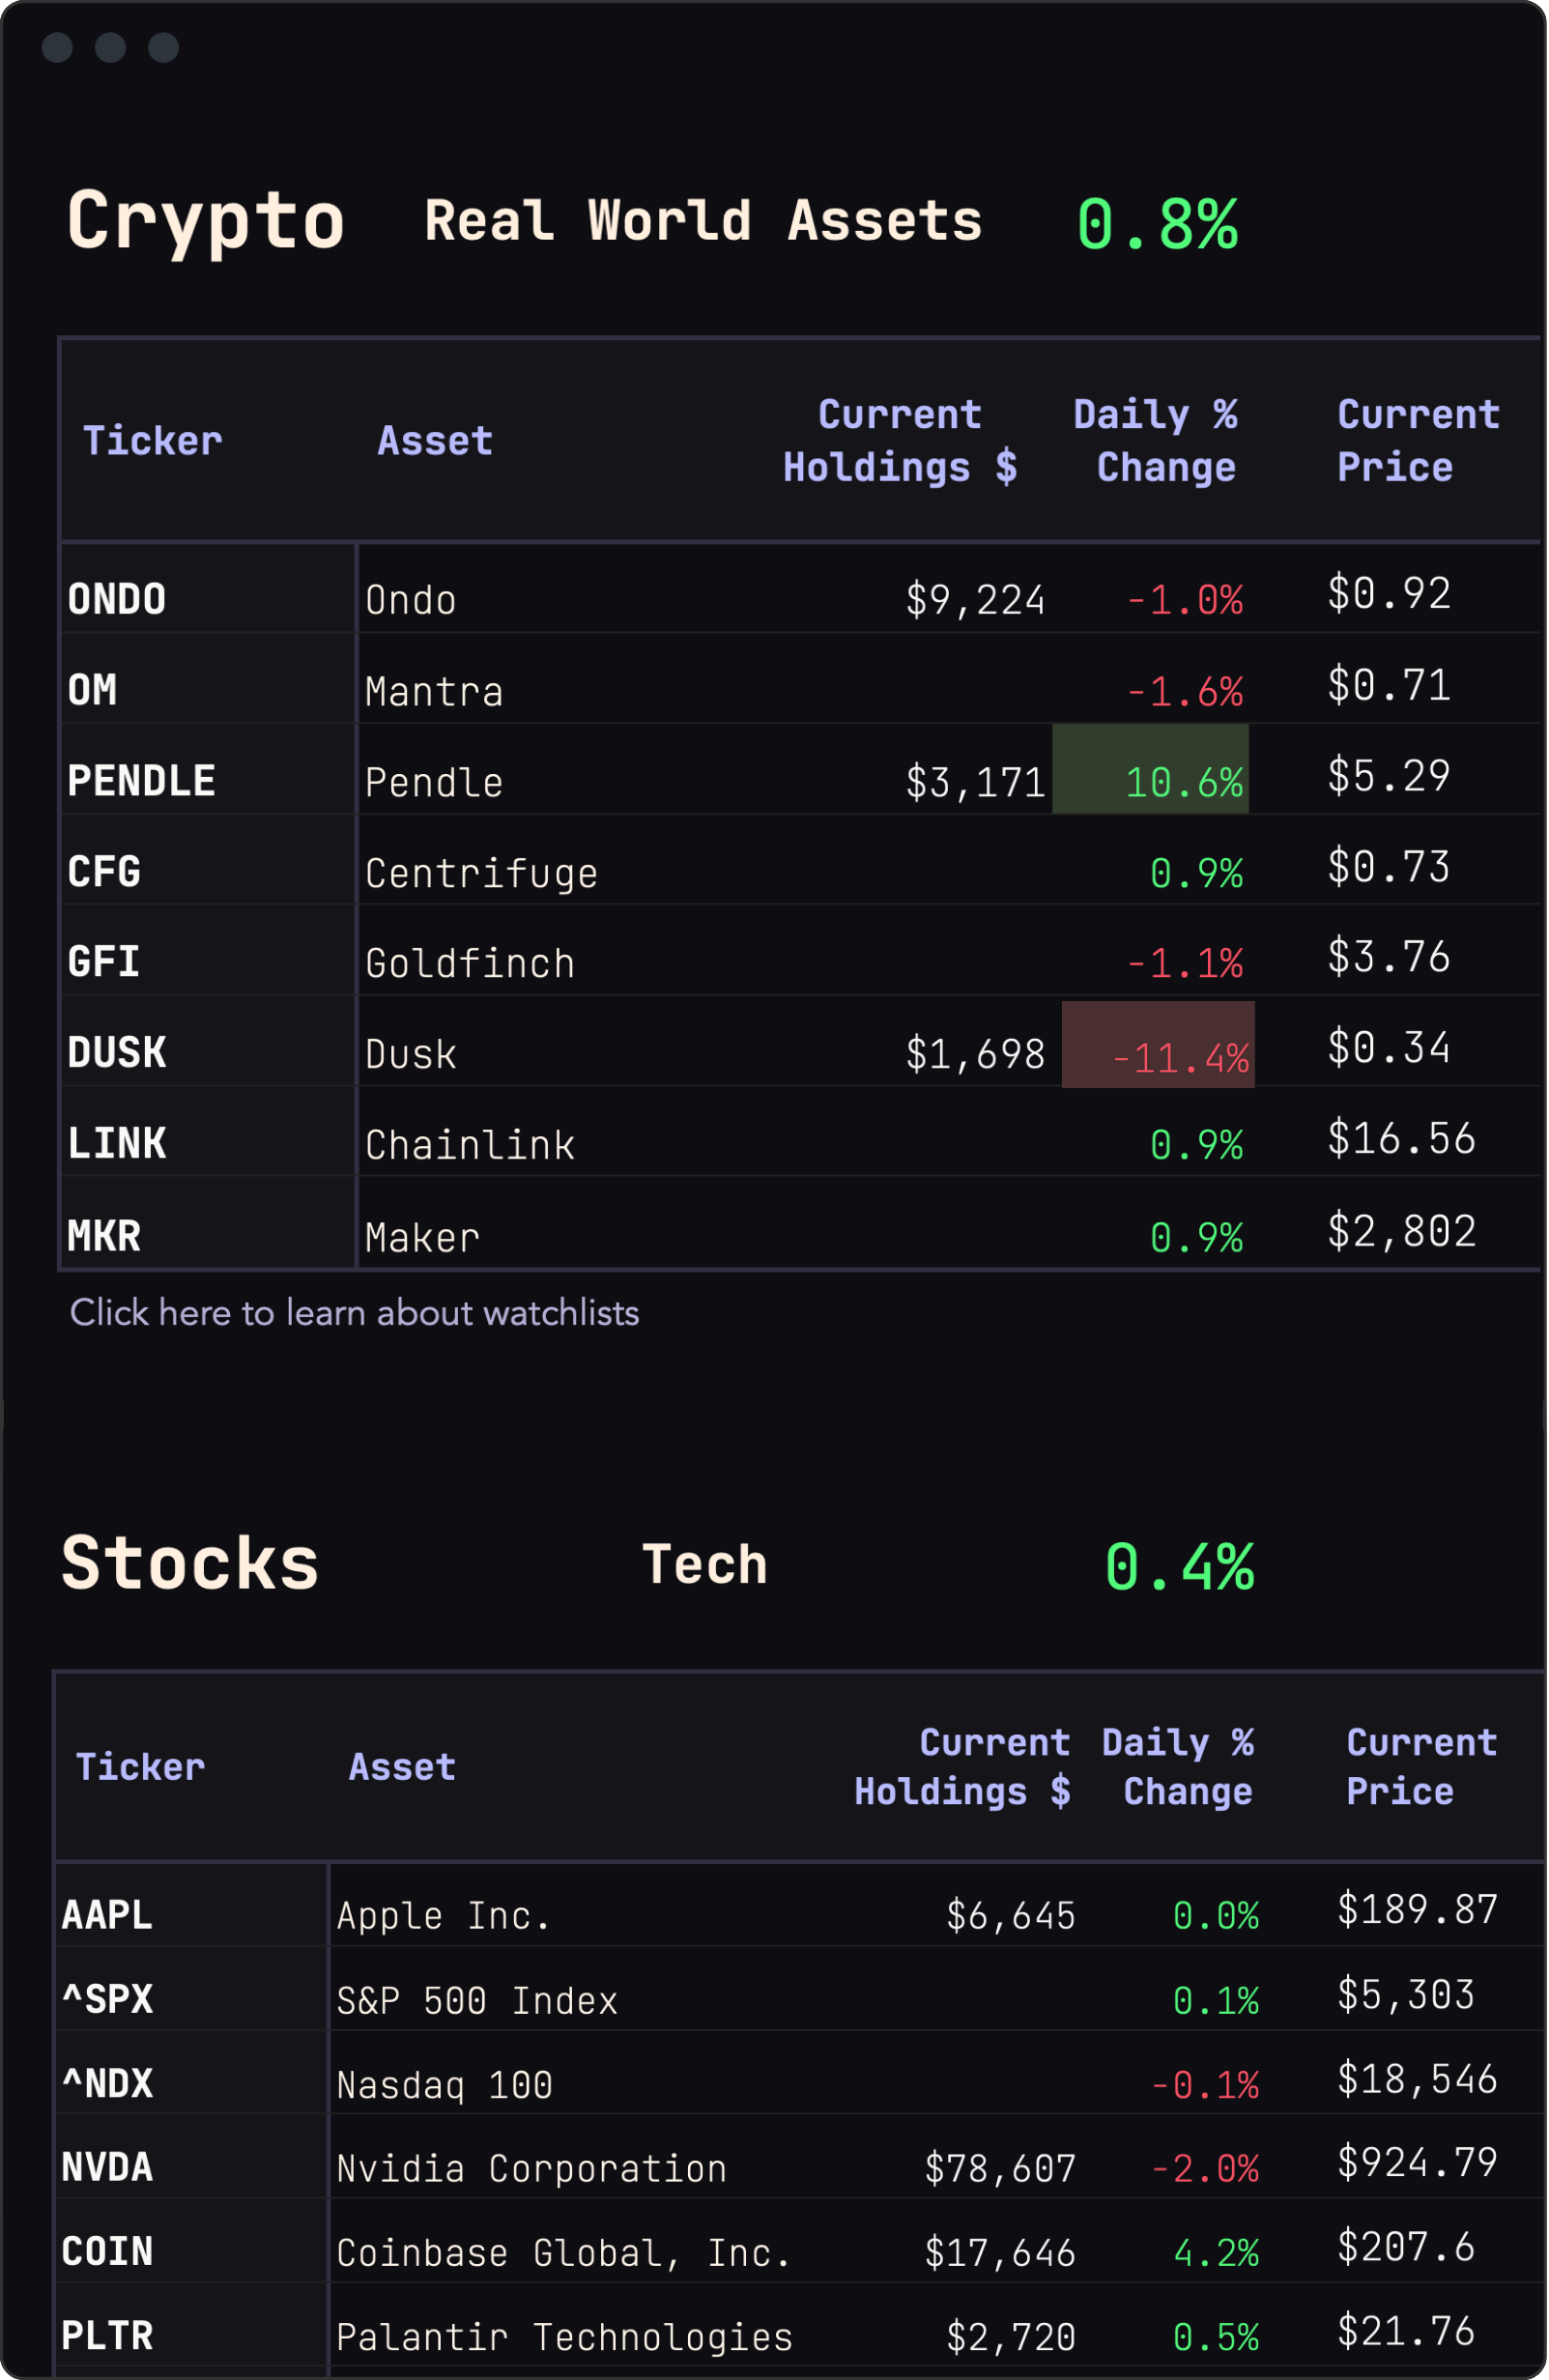
The ⭐️ **Watchlists** tab allows you to create multiple watchlists.&#x20;

The watchlists are housed in table-blocks that you can duplicate and reorder easily.&#x20;

### Creating Watchlists

Each table-block is either a *stocks* watchlist or a *crypto* watchlist. You set this in cell A1 of each block.&#x20;

<figure><img src="/files/AwFQ4o0Wi7c6X6D5Ic1E" alt="" width="375"><figcaption><p>Setting the Watchlist Type.</p></figcaption></figure>

After setting the type for a block, enter some tickers in column A. The watchlist will immediately populate with relevant information. &#x20;

Duplicate the blocks to create as many watchlists as you want. Name your lists in cell B1.

<figure><img src="/files/8ayuxB5qlgqs4ZPzmZhj" alt="Smol Compute - Portfolio Tracker – Premium Templates for Apple Numbers."><figcaption><p>The Watchlists Tab</p></figcaption></figure>

### Using the Target Market Cap Tool

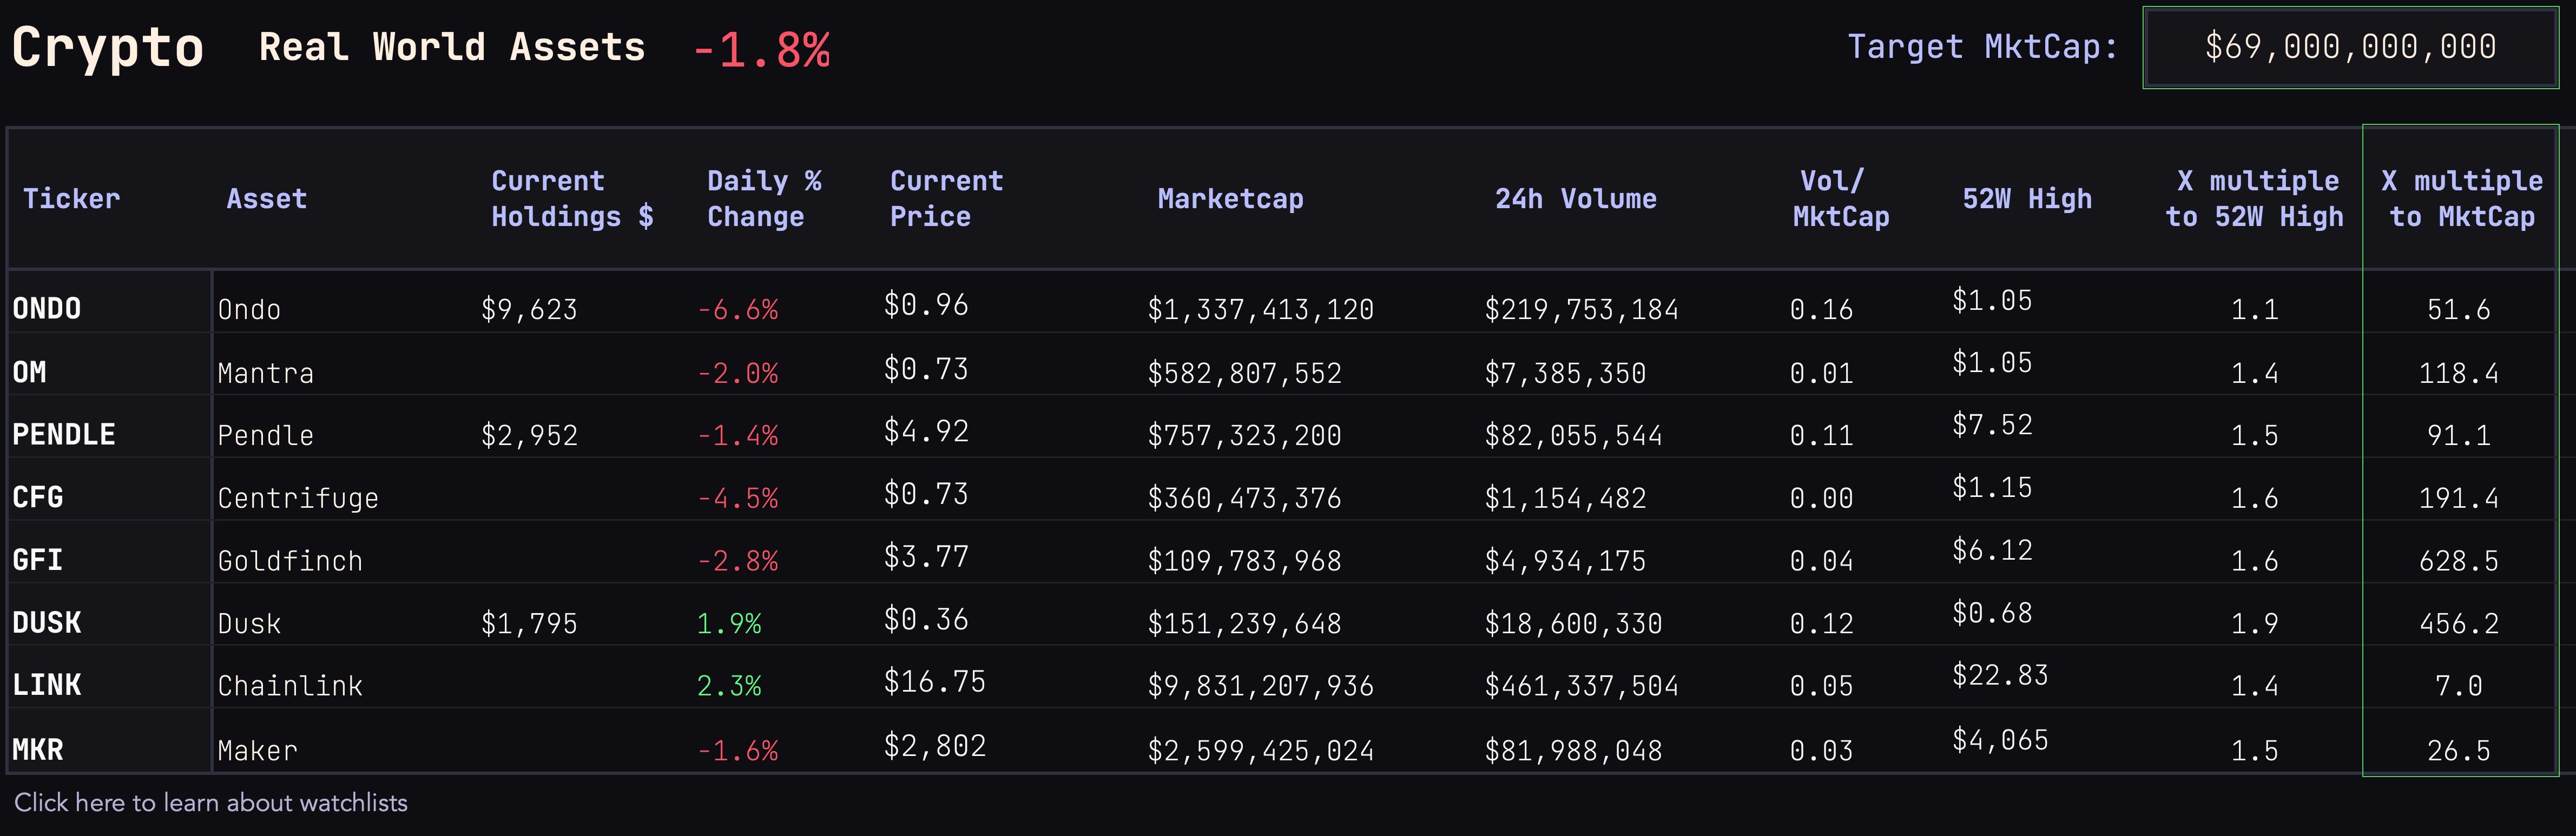
The **Target MktCap Tool** allows you to set a target market cap to see, for each asset in your watchlist, the X multiple in market cap growth that corresponds to this asset reaching the target market cap.&#x20;

For example:&#x20;

Say I set the target market cap to $69,000,000,000, roughly the current market cap of DOGE.&#x20;

Column L will then display the X multiple implied by each asset reaching a market cap of $69,000,000,000.&#x20;

Since the current market cap of MKR is roughly $2,600,000,000, reaching the target market cap would mean roughly a 26.5 X increase in the price of the MKR token (assuming the circulating supply stays the same). &#x20;

<figure><img src="/files/zON3jkMlEQbYMr5ii4gm" alt=""><figcaption><p>The Target MktCap Tool</p></figcaption></figure>

See the included  Demo Portfolio to get familiarized with this new section.&#x20;


# Changing the Primary Currency

How to change the primary currency of the Portfolio Tracker.

## Changing the Currency Format

The Portfolio Tracker’s default currency is set to USD, but you can change the primary currency if you’re using a different base currency.\
For example, if you’re in Canada and trading in Canadian dollars, you can change the primary currency to CAD. Here’s how:

1. Open a new instance of the Tracker, go to any of the Account tabs  and click in cell <mark style="color:green;">**C2**</mark> in the Top Line Stats.
2. In the menu,  go to <mark style="color:green;">**View > Inspector > Format**</mark> to reveal the Sidebar.&#x20;
3. At the top of the sidebar, click on the **Cell** tab. The **Data Format**, should be set to "Smol Currency".  Click on "<mark style="color:green;">**Edit Custom Format**</mark>" &#x20;
4. In the modal that opens up, you'll see a number of rules, each starting with a <mark style="color:green;">**$**</mark> sign. Click on that sign and select the currency you want to use instead.&#x20;
5. Do this for each rule, then click OK.&#x20;

You'll notice that the currency of the Tracker has now been changed to display CA$ everywhere. &#x20;

<figure><img src="/files/2Dti1F2uuoayFZ7WCXi1" alt="Smol Compute– Premium Templates for Apple Numbers."><figcaption><p>Change the currency format</p></figcaption></figure>

{% hint style="info" %}
If you find that this takes up too much space in your cells, you can go back and edit the format custom format "Smol Currency". You can get rid of the currency symbol altogether. &#x20;
{% endhint %}

### Video Walkthrough

{% embed url="<https://www.youtube.com/watch?v=0LOlgIz3se0>" %}
Video Guide&#x20;
{% endembed %}

## Trading in your local currency.&#x20;

**if you change the primary currency you'll want to enter trades for assets&#x20;*****denominated in your newly chosen primary currency.***&#x20;

***We recommend making***[ ***special assignations*** ](/1/how-to/stocks-listed-on-non-us-exchanges)***for each non-usd-denominated asset you trade.***&#x20;

For example, if I want to enter trades for **Bitcoin denominated in CAD**,  I'll specify in the Special Assignations table that the ticker "BTC" refers to the asset code "BTC-CAD". Doing so will ensure that the current price of Bitcoin is quoted in CAD. If I don't do this, the current value of my holdings will be denominated in USD, while your cost basis will be in CAD, which will produce an erroneous P\&L.

Similarly, if you are trading stocks of the Onex Corporation listed on a Canadian stock market, you'll want to enter its asset code next to the ticker you wish to use for it (in this case, ONEX). The Tracker will then remember that the ticker ONEX refers to stocks of the Onex Corporation denominated in Canadian dollars.

<figure><img src="/files/d2inmL95KZGq4MvfpZnh" alt="Trading assets in your local currency - Investment Tracker for Apple Numbers"><figcaption><p>Making Assignations for CAD denominated assets.</p></figcaption></figure>

{% hint style="info" %}
Special Assignations are optional. I could simply enter ONEX.TO directly in the Trade Log. The Special Assignation allows for a cleaner trade entry.&#x20;
{% endhint %}


# Optional Secondary Currency

The smol Portfolio Tracker allows you to easily set a secondary currency used to display important stats about your portfolio in a currency other than USD.

## Setting a Secondary Currency

By default, the secondary currency is set to "None".&#x20;

To select one, go to the **Dashboard,** select the cell directly to the right of where it says "**Optional 2nd Currency**" (upper right corner). Click on the down arrow to reveal the pop-up menu with the list of available currencies.&#x20;

For example, to set the Canadian Dollar as your secondary currency, type in "**CAD=X**"

<figure><img src="/files/cg19ZEcYGSfvJE2ME3BJ" alt="Setting the secondary currency for your portfolio"><figcaption><p>Setting the secondary currency for your portfolio</p></figcaption></figure>

## Stats That Make Use of the Secondary Currency

Upon setting the secondary currency, you will immediately see values in that currency appear in the Summary on your Dashboard (to the right of the USD values).

<figure><img src="/files/oN8QNBX0dUiyOiAtuiaE" alt="Portfolio Summary with Stats in Alternative Currency"><figcaption><p>Portfolio Summary with Stats in Alternative Currency</p></figcaption></figure>

Once set, on your active **Accounts**, additional stats in that currency will show up on the rightmost column of the Top Line, and the currency you have selected will be displayed in <mark style="color:green;">C1</mark>.&#x20;

<figure><img src="/files/E2tfjuBDbWCwTehMcd5A" alt="Realized and Current Unrealized P&#x26;L displayed in CAD in addition to USD values."><figcaption><p>Realized and Current Unrealized P&#x26;L displayed in CAD in addition to USD values.</p></figcaption></figure>

<figure><img src="/files/tGU5OFUmbVqaJ5oXKxsm" alt="Holdings Table with Realized P&#x26;L in Alternative Currency"><figcaption><p>Holdings Table with Realized P&#x26;L in Alternative Currency</p></figcaption></figure>

In the [**Trade Log**](/1/tracker/accounts#trade-log) the "**Realized P\&L (secondary)**" column will display your stats in that currency on to the right of the USD value.&#x20;

<figure><img src="/files/14S9xMqnYNEx5o86smjo" alt="Account&#x27;s P&#x26;L displayed in CAD in addition to USD"><figcaption><p>Account's P&#x26;L displayed in CAD in addition to USD</p></figcaption></figure>

##

## Available Currencies

**Canadian Dollar** (USD/CAD)  [CAD=X](https://uk.finance.yahoo.com/quote/CAD%3DX?p=CAD%3DX) &#x20;

**British Pound** (USD/GBP)  [GBP=X](https://uk.finance.yahoo.com/quote/GBP%3DX?p=GBP%3DX) &#x20;

**Euro**  (USD/EUR)  [EUR=X](https://finance.yahoo.com/quote/EUR=X/)

**Euro Alt** (USD/EUR) [USDEUR=X](https://finance.yahoo.com/quote/USDEUR=X/)

**Hong Kong Dollar**  (USD/HKD)  [USDHKD=X](https://uk.finance.yahoo.com/quote/USDHKD%3DX?p=USDHKD%3DX) &#x20;

**Singapore Dollar**  (USD/SGD)  [USDSGD=X](https://uk.finance.yahoo.com/quote/USDSGD%3DX?p=USDSGD%3DX) &#x20;

**Japanese Yen** (USD/JPY)  [JPY=X](https://uk.finance.yahoo.com/quote/JPY%3DX?p=JPY%3DX)&#x20;

**Indian Rupee**  (USD/INR)  [INR=X](https://uk.finance.yahoo.com/quote/INR%3DX?p=INR%3DX)&#x20;

**Swiss Franc** (USD/CHF)  [CHF=X](https://uk.finance.yahoo.com/quote/CHF%3DX?p=CHF%3DX)&#x20;

**Chinese Yuan**  (USD/CNY)  [CNY=X](https://uk.finance.yahoo.com/quote/CNY%3DX?p=CNY%3DX) &#x20;

&#x20;**Russian Rouble** (USD/RUB)  [USDRUB=X](https://ca.finance.yahoo.com/quote/USDRUB%3DX?p=USDRUB%3DX)

**Mexican Peso**  (USD/MXN)  [USDMXN=X](https://uk.finance.yahoo.com/quote/USDMXN%3DX?p=USDMXN%3DX)&#x20;

**Philippine peso**  (USD/PHP)  [USDPHP=X](https://ca.finance.yahoo.com/quote/USDPHP%3DX?p=USDPHP%3DX) &#x20;

**Indonesian Rupiah**  (USD/IDR)  [USDIDR=X](https://ca.finance.yahoo.com/quote/USDIDR%3DX?p=USDIDR%3DX)&#x20;

**Thai Baht** (USD/THB)  [USDTHB=X](https://ca.finance.yahoo.com/quote/USDTHB%3DX?p=USDTHB%3DX)&#x20;

**Malaysian Ringgit**  (USD/MYR)  [USDMYR=X](https://ca.finance.yahoo.com/quote/USDMYR%3DX?p=USDMYR%3DX)&#x20;

**South African Rand**  (USD/ZAR)  [USDZAR=X](https://ca.finance.yahoo.com/quote/USDZAR%3DX?p=USDZAR%3DX)&#x20;

**Swedish Krona** (USD/ZEK)   [ZEK=X](https://finance.yahoo.com/quote/SEK=X?.tsrc=fin-srch)

**Australian Dollar** (USD/AUD)   [AUD=X](https://finance.yahoo.com/quote/AUD=X?.tsrc=fin-srch)

**New Zealand Dollar**  (USD/NZD)   [NZD=X](https://finance.yahoo.com/quote/NZD=X?.tsrc=fin-srch)

**Brazilian Real**  (USD/BRL)  [BRL=X](https://finance.yahoo.com/quote/BRL=X?.tsrc=fin-srch)

**United Arab Emirates Dirham** (USD/AED)   [AED=X](https://finance.yahoo.com/quote/AED=X?.tsrc=fin-srch)

**Israeli New Shekel** (USD/ILS)  [ILS=X](https://finance.yahoo.com/quote/ILS=X?.tsrc=fin-srch)

**South Korean Won**  (USD/KRW)   [KRW=X](https://finance.yahoo.com/quote/KRW=X?.tsrc=fin-srch)

**Turkish Lira**  (USD/TRY)   [TRY=X](https://finance.yahoo.com/quote/TRY=X?.tsrc=fin-srch)

**Saudi Riyal**   (USD/SAR)   [SAR=X](https://finance.yahoo.com/quote/SAR=X?.tsrc=fin-srch)

**Egyptian Pound**  (USD/EGP)    [EGP=X](https://finance.yahoo.com/quote/EGP=X?.tsrc=fin-srch)

**Danish Krone** (USD/DKK)   [DKK=X](https://finance.yahoo.com/quote/DKK=X?.tsrc=fin-srch)

**Argentine Peso**   (USD/ARS)    [ARS=X](https://finance.yahoo.com/quote/ARS=X?.tsrc=fin-srch)

**Bulgarian Lev**  (USD/BGN)  [BGN=X](https://finance.yahoo.com/quote/BGN=X?.tsrc=fin-srch)

**Polish Złoty**   USD/PLN   [PLN=X](https://finance.yahoo.com/quote/PLN=X?.tsrc=fin-srch)

**Czech Koruna**  (USD/CZK)  [CZK=X](https://finance.yahoo.com/quote/CZK=X?.tsrc=fin-srch)

**New Taiwan Dollar**   (USD/TWD)  [TWD=X](https://finance.yahoo.com/quote/TWD=X?.tsrc=fin-srch)


# Troubleshooting

If you encounter issues with your Portfolio Tracker  please make sure you are using the current version of Numbers as updating and opening a fresh copy of the Portfolio Manager is likely to resolve the issues. &#x20;

If the Holdings Table and the Portfolio Breakdown are registering the wrong assets or showing error symbols, make sure that you have selected the correct[ account type](/1/tracker/accounts#account-type) (Stocks or Crypto). &#x20;

If the asset name and price still don't match the ticker you are trading, you can fix this by making a [Special Assignation](/1/how-to/confused-asset-codes).

[Fixing an **erroneous asset match** in your Holdings](/1/how-to/confused-asset-codes)

If you are still encountering an issue or think you have found a bug, please [reach out ](< https://smolcompute.xyz/contact>)so we can fix it or try to help you.&#x20;


# Changelog

Smol Portfolio Tracker

## V4.4

2024-10-12

* [A much quicker way to change the primary currency](/1/tracker/changing-the-primary-currency) of your Tracker.&#x20;
* Minor UI changes to the Dashboard to make it breadth a bit more and fit more screen sizes.&#x20;
* Also, Smol Compute has a brand new [website](https://smolcompute.xyz) !

## V4.0&#x20;

2024-05-15

Biggest update to date!  The smol Portfolio Tracker has been rebuilt from the ground up while maintaining backwards compatibility - just paste your trades and your snapshots in and you'll be able to pick up right where you left off!

* **The Trade Log is finally made up of a single table**:  A bug in Numbers had forced us to use two tables in order to make the Trade Log sortable. After some back and forth with the veteran experts of Numbers's community forums, we found a work-around that eliminates the issue! This fix makes it a lot easier to add new rows and to move the Trade Log around on in your Accounts.&#x20;
* **Two new columns added to the Trade Log**:  You now have two additional columns in the P\&L section. The first (**% P\&L VS Current Price**) tells you in % terms how much higher or lower the current price is vis a vis the price transacted at (for each row / transaction). If the row registers a SELL event, the calculation is inverted, so that if the currenrt price is higher than the price you sold at, you will see a negative % P\&L.  The second column (**$ P\&L VS Current Price**) uses that percentage and multiplies it by the $amount transacted, letting you know in $ terms how much you may have gained or lost. N.B: *These columns are purely for informational use and do not affect in any way the calculation of your account's P\&L.*&#x20;
* **A new and improved Holdings header with useful stats:** Top gainer, top loser, number of trades taken in the account, as well as the daily percentage change in total value of your account.&#x20;
* **Clickable asset names** :  You can now click on assets' names in your Holdings, Portfolio Breakdown, Watchlists, etc. Doing so will bring you to the asset's page on Yahoo Finance where you can see live advanced charts (line, candles, bars),  relevant news, and  much more.  This works for all supported assets, and respect your selections in special assignations if you have made any.&#x20;

<figure><img src="/files/vQigqrkcDQ9TChrHnqLC" alt=""><figcaption></figcaption></figure>

* **New widgets on your Dashboard** : You have new ways to visualize your P\&L. We think these will be very useful!  Here's an example from the included  Demo Portfolio :

<figure><img src="/files/zXkx4v4MjqU6gW9k01z2" alt=""><figcaption><p>New Widgets for P&#x26;L Visualizations</p></figcaption></figure>

* **Improved secondary currency picker and added support for new currencies:** smol compute now supports over 30 secondary currencies. When you select a secondary currency, the current exchange rate is now displayed next to your selection.&#x20;
* **A new tab for your Watchlists** : You can now create watchlists simply by entering a ticker you want to track.  Select Crypto or Stocks for each watchlist, then enter some tickers. The watchlists will immediately populate with relevant information.  Duplicate the blocks to create as many watchlists as you want. See the included  Demo Portfolio to get familiarized with this new section.&#x20;

<figure><img src="/files/6kO6bK1Zss8c9nVvOiCS" alt=""><figcaption><p>New Watchlists Tab</p></figcaption></figure>

* **2 New themes (deprecation of the older themes)** : We realized that having only 2 themes would allow us to spend less time updating themes and more time making our products better. So we will be deprecating the themes of the previous versions. To make the change easier, we created 2 new color themes which we think are the slickest we've ever made!  One neat feature new to these themes are handy discreet links underneath each blocks that will lead you directly to the relevant part of the user guide.
* There are countless small over changes. As we said, we really have rebuilt the Portfolio Manager from the ground up.  If you find any issue with the update, please do not hesitate to reach out!&#x20;

## V3.0

Version 3 brings some smol changes and some big quality of life improvements:

* **Simplified P\&L Tracking** :  Following user feedback, the way the P\&L for the accounts is calculated has been rethought in order to eliminate the need to manually enter deposits and withdrawals in your accounts and keep track of the amount of USD you hold. Both the "Cash Balance" and the "Cost of Account" sections are now gone. Instead, the tracker will automatically keep track of your accounts' costs, while cash won't be included in the calculation.  We think this makes a lot more sense for most users and hope the it will save you some time and headaches!
* **Much improved ticker-to-asset matching** : The Tracker already automatically matched tickers to assets for all assets listed on Yahoo Finance and CoinMarketCap, however, Yahoo sometimes uses irregular asset codes which could lead to issues. For example, the asset code for Uniswap is "UNI7083" rather than simply "UNI". **We have manually encoded a fix that will automatically solve this for the top 500 crypto assets listed on CoinMarketCap / Yahoo**. So you can now simply enter "UNI" in your Trade Log and the Tracker will know to match this ticker to the Uniswap asset (and provide you with accurate price data for it).&#x20;
* **New way to make custom ticker-to-asset matches** : In case you are trading exotic microcap assets with irregular asset codes,  you can now quickly specify which asset should be matched to a ticker in the new "Special  Assignations" widget situated in the sidebar (to the right). You'll see "UNI" already listed as an example. You can find out how this widget works [here](/1/how-to/confused-asset-codes).

<figure><img src="/files/FVizXejojEnkPY5MvFiB" alt="" width="375"><figcaption><p>The New Special Assignations Widget</p></figcaption></figure>

* **Updated automated account Holdings and Portfolio Breakdown tables:**  Both of these tables will now appear "rowless" until you begin entering trades in the Trade Log of one of your accounts. A new row will be automatically added for each new asset you trade in one of your accounts. This allows us to better automate these tables without cluttering the layout.&#x20;
* **Many** **smaller improvements** have been made throughout the Tracker, such as a couple of new metrics added to the Holdings table and improved support for secondary currencies.&#x20;
* **Change of name:**  smol compute has a new product!  It consists of a *single-account* portfolio tracker. This product is inheriting the name "smol Portfolio Tracker", because it is, well, smoller than it's big brother.  The multi-account tracker is now called the smol **Portfolio Manager**! The name change does not affect your capacity to receive updates for the tracker you purchased.  You can visit the new smol Portfolio Tracker [here](https://smolcompute.xyz/b/smol-portfolio-tracker).&#x20;

## V2.0

* New theme! Say hello to the[ Bloomberg Terminal color theme. ](/1/how-to/brand-assets#bloomberg-terminal)

<figure><img src="/files/LCTHrmRonMBPMxoV7ilm" alt=""><figcaption><p>Bloomberg Terminal Color Theme</p></figcaption></figure>

* The main currency now defaults to USD. If your OS's region is set to USA you you should only see the $ symbol. For all other regions, you may see "US$". <br>
* The [**Portfolio Breakdown** ](/1/tracker/dashboard#portfolio-breakdown)now self-populates, pulling data automatically from all your accounts. <br>
* You can now select a [**secondary currency** ](/1/tracker/secondary-currency)from a pop-up menu in the top right corner of [**Portfolio Summary**](/1/tracker/dashboard#portfolio-summary) on[ **the Dashboard.**](/1/tracker/dashboard) Your Portfolio's Current Value, Lifetime Cost, and P\&L will then be displayed in that currency (in addition to their USD values). This will also activate the use of the secondary currency in the [**Trade Log**](/1/tracker/accounts#trade-log) for the Realized P\&L.&#x20;

<figure><img src="/files/VUWONRcOzFwpvZ0w8xyw" alt=""><figcaption><p>Selecting a Secondary Currency</p></figcaption></figure>

Version 2.0  sees a  much improved [**Account**](/1/tracker/accounts) page.&#x20;

* You can now easily specify each [**account's type**](/1/tracker/accounts#account-type) simply by selecting "**Crypto**" or "**Stocks**" in the pop-up menu in the cell right next to the account name (C1) at the top of the sheet. &#x20;

<figure><img src="/files/Shr4XfOLKMoDl4NTWoTK" alt="" width="563"><figcaption><p>Setting the Account's Type</p></figcaption></figure>

The [**Trade Log** ](/1/tracker/accounts#trade-log)has been entirely rebuilt. (It of course retains our unified formatting so you can simply copy and paste from one version to the other without any issue).&#x20;

* You can now **sort your trades** by header columns.  The main utility of this is the ability to add trades to the Trade Log and not have to worry about entering them in chronological order. You can simply add trades to the bottom of the list, then sort the list by dat&#x65;**,** and everything will then get computed correctly.\
  \
  A good use case might be if you are using more than one exchange to trade Bitcoin, but want still want all these trades computed as one (say, for tax purposes). You want to know your P\&L and cost basis for Bitcoin ***across all Exchanges,*** not just on one exchange. Simply enter all your trades in the account's Trade Log and then sort by date and your costs basis and P\&L will be correctly computed across all exchanges, wallets, etc. (Use the Smol Formatter if you want to bulk import trades).

<figure><img src="/files/rqyNyykqVpegys06E2F1" alt="" width="563"><figcaption><p>Sorting your Trade Log by by date.</p></figcaption></figure>

* You now have the ability to enter FEES as events in the [**Trade Log**](/1/tracker/accounts#trade-log).  \
  \
  In addition to "BUY" and "SELL", the **Side** column now offers you a third option, **"FEES".**  \
  \
  This has a different use case than the Fees column of the Trade Log, though it accomplishes the same thing, i.e., adding fees to the cost basis of a *particular asset*. \
  \
  So why use it? In crypto, there are often network fees to pay *even when we are not buying or selling anything*. Each time we interact with the blockchain, we must pay a gas fee. These fees impact your final P\&L. The FEES option allows you to log these fees and add them to the cost basis of the asset concerned in the blockchain interaction. &#x20;

<figure><img src="/files/BkY6cRCVon5DWJe6GmuW" alt=""><figcaption><p>Adding FEES to the cost basis of PENDLE and RDNT</p></figcaption></figure>

* The [**ROI tool** ](/1/tracker/roi-tool)has a[ new chart](/1/tracker/roi-tool#portfolios-value-in-usd-btc-and-eth-terms) that plots your portfolio's historical value denominated in USD, BTC, & ETH.&#x20;

<figure><img src="/files/Wa6u0Yw4tzx9PaUkgpCK" alt=""><figcaption><p>Portfolio's Historical Value denominated in BTC &#x26; ETH</p></figcaption></figure>


# Portfolio Tracker Lite


# Quick Start

Your download includes 4 files:

* A fresh copy of the template in light theme
* A fresh copy of the template in dark theme
* A demo copy already populated with data
* A setup guide

### Let's get going!

Pick a colour theme and open a fresh copy in Numbers..

### 1.  Set the account type. &#x20;

Select your <mark style="color:green;">**Portfolio's Type**</mark> in <mark style="color:green;">**B1**</mark> using the pop-up menu **(Crypto or Stocks)**.&#x20;

<figure><img src="/files/BqO1tLuZpzSIphXS3QDV" alt="Portfolio Tracker – Premium Templates for Apple Numbers."><figcaption></figcaption></figure>

### 2. Set your base currency

If you won't be using the US dollar as your primary currency, you can [**change the primary currency**](/1/smol_tracker/changing-the-primary-currency) now, or you can change it later.&#x20;

### 3. Enter your first trade

Scroll down to the [**Trade Log**](/1/tracker/accounts#trade-log) and enter your first trade! The first 7 columns (the lighter ones) are where you input your trade details. The "**Account**" and "**Fees**" columns are optional. The columns titled "**Realized P\&L**" only display values when you ***sell*** an asset, so you won't see anything here just yet. &#x20;

<figure><img src="/files/EsVzfWUtMemODQ27hx6e" alt="Portfolio Tracker – Premium Templates for Apple Numbers."><figcaption></figcaption></figure>

**That's it!  You're Portfolio Tracker is now set-up and ready to go!**&#x20;

The [**Holdings** ](/1/smol_tracker/holdings)table, and the [**Dashboard**](/1/smol_tracker/dashboard) have now been automatically updated with live stats for your new asset. These will automatically update each time you add a trade in your Trade Log.  Some of these charts may appear empty at first—they need more data to populate. But here’s an example of what you’ll see soon enough.

<figure><img src="/files/78WrTaq0sjfh02Nrtp60" alt="Portfolio Tracker – Premium Templates for Apple Numbers."><figcaption></figcaption></figure>

{% hint style="success" %}
**Optional:** Your Tracker uses the US Dollar as its default currency. If you would like your P\&L to be tracked in a [secondary currency](/1/smol_tracker/optional-secondary-currency) (in addition to the USD), select a currency in the pop-up menu in cell <mark style="color:green;">C1</mark> (where it says "Alt Currency Picker").&#x20;
{% endhint %}

#### Learn more:&#x20;

* [Tips and Tricks](/1/how-to/tips-and-tricks)
* [How to **change the primary currency.** ](/1/tracker/changing-the-primary-currency)
* [How to set a **secondary currency.**](/1/smol_tracker/dashboard#optional-secondary-currency)
* [Learn about the **Trade Log** ](/1/smol_tracker/trade-log)
* [Learn about the **Holdings Table**](/1/smol_tracker/holdings)
* [Lean how to fix an **erroneous asset match.**](/1/how-to/confused-asset-codes)
* [Sync using end-to-end encryption.](/1/how-to/turning-on-end-to-end-encryption)
* [Where can I use smol compute?](/1/how-to/what-devices-can-i-use-smol-compute-on)&#x20;


# Dashboard

The Dashboard lives at the top of each sheet.&#x20;

<figure><img src="/files/OWVD97V4ukckI0llFRPJ" alt="Portfolio Tracker – Premium Templates for Apple Numbers."><figcaption><p>Dashboard</p></figcaption></figure>

## Topline Stats

At the very top, you can see your portfolio's current stats, such as:&#x20;

<figure><img src="/files/fz7dOqhfX7BpvioDNsII" alt=""><figcaption><p>Portfolio's Top Line Stats</p></figcaption></figure>

* your portfolio's **overall P\&L** in USD terms
* your portfolio's **overall P\&L** in % terms
* its **current value**&#x20;
* it's **cost** (the capital you have put in minus the capital you have taken out)
* your **realized P\&L**
* the **current unrealized P\&L** on the assets currently held in the account. &#x20;

{% hint style="info" %}
**Tip:**  The **Realized P\&L** is likely to be the amount you should keep an eye on for taxes! If you have [set a secondary currency,](/1/smol_tracker/dashboard#optional-secondary-currency) the realized P\&L can also be viewed in that currency to the right of the USD values.&#x20;
{% endhint %}

The Top Line Stats is also where you set your **portfolio's type** (B1) and **the optional secondary currency** (C1). Both cells are pop-up menus giving you options to select from.&#x20;

### Portfolio Type

Each portfolio can either be a **crypto** portfolio or a **stocks** portfolio. If you enter crypto trades into a stocks account (or vice-versa), the automatically generated [**Holdings**](/1/smol_tracker/holdings) table won't be able to properly recognize the asset codes you enter into the [**Trade Log**](/1/smol_tracker/trade-log)**.**[ ](/1/smol_tracker/trade-log)

You define the portfolio type by choosing from the pop-up menu in cell B1 in the Top Line Stats of your portfolio.

<figure><img src="/files/8fLfCimvSAHomY981eSP" alt="" width="563"><figcaption><p>Choosing the portfolio type</p></figcaption></figure>

## P\&L Chart

The P\&L Chart allows you to monitor the current **unrealized % profits and losses** on your assets visually.&#x20;

This is useful to see at a glimpse when it’s time to take profit or cut your losses and to quickly see where you stand with each of your current holdings.

<figure><img src="/files/xeEvWRCabMCNTWNe3Vlg" alt="Portfolio Tracker – Premium Templates for Apple Numbers." width="563"><figcaption><p>The P&#x26;L Widget</p></figcaption></figure>

## Allocation Chart

The Allocation Widget allows you to visually monitor your portfolio's allocation as it changes with market fluctuations. &#x20;

Assets representing less than 3% of your portfolio will be filed under "Other".

<figure><img src="/files/DEwIYUCC4HXVxba10z8y" alt="Portfolio Tracker – Premium Templates for Apple Numbers." width="563"><figcaption><p>Allocation Widget</p></figcaption></figure>


# Trade Log

Right below the [Holdings](/1/smol_tracker/holdings) table is the **Trade Log.** &#x20;

{% hint style="info" %}
You only need to enter data in the *first section* of the Trade Log. The  Stats and P\&L sections will self-populate to reflect the trade you just entered.&#x20;
{% endhint %}

<figure><img src="/files/lgD1uZOXlCduUrFPoRIf" alt="Portfolio Tracker – Premium Templates for Apple Numbers."><figcaption><p>The Trade Log</p></figcaption></figure>

The Trade Log is composed of 4 sections:&#x20;

* The first section is where you enter your trades (lighter cells).
* &#x20;The second section automatically displays useful updated stats about your holdings, reflecting the trade you just added to your Trade Log.&#x20;
* The third section displays the P\&L VS Current price and the final P\&L of each ***realized event*** (aka a SELL entry in the trade log), basically telling you how much money you made or loss on the trade.&#x20;
* The fourth section is for optional comments on your trade.&#x20;

## Trade Entry Section

The **first 7 columns** (the lighter ones) are where you enter your trades. This is self-explanatory, but let's go over the details.&#x20;

<figure><img src="/files/K0hrlxwv0gKW10pdaOH4" alt="Trade Log&#x27;s Entries Section" width="563"><figcaption><p>Trade Log's Entries Section</p></figcaption></figure>

* **Date**: the date of the trade.  This column is pre-formatted to use a universal standard.

{% hint style="warning" %}
Please note that the date should be precise enough to allow for *<mark style="color:green;">**chronological sorting**</mark>* of your trades. In some cases, the ***time*** of the trade , in addition to its date, will be necessary (e.g., if you are both buying *and* selling the same asset **on the&#x20;*****same day***).&#x20;
{% endhint %}

{% hint style="info" %}
**Tip:**   A quick way to enter the *exact date and time* is via the application's menu.&#x20;

Go to Table > Insert Current Time (this will enter *both* the date and the time down to the second). &#x20;

Even quicker:  hit  **Control - Shift - Command - T**

If you are batch-importing your trades via the [smol Formatter](/1/formatter), the correctly formatted date and time will carry over.&#x20;
{% endhint %}

* **Account:** This is for optional metadata (E.g., Binance, Robinhood, 0xacB69, TFSA)
* **Side:** BUY or SELL (or FEES, see box below).&#x20;
* **Market:** The asset code (ticker) of the asset traded.
* **Quantity:** The number of units bought or sold.
* **Price:** The USD price the asset was traded at.
* **Fees:** Optionally, any fees incurred for that trade. The fees you enter here will be added to your **cost basis** for that specific asset and will be reflected in your final P\&L.

{% hint style="info" %}
In addition to "BUY" and "SELL", the **Side** column offers you a third option, **"FEES".**  The reason is that, in crypto, there are often network fees to pay even when we are not buying or selling. Each time we interact with the blockchain, we must pay a gas fee. These fees impact your final P\&L. *The FEES option allows you to log these fees and* *add them to the cost basis of the asset concerned in the blockchain interaction.&#x20;*&#x20;
{% endhint %}

<figure><img src="/files/QJJOda2MFYffqTattyZQ" alt=""><figcaption><p>Network fees entered for the PENDLE token.</p></figcaption></figure>

## Stats Section

The **Stats** section maintains important values updated with each event, such as the updated total of units owned for the asset  as well as its updated cost basis. Many will find these columns informative and useful, but they can also be hidden if you don't have any use for this information. Do not delete them though.&#x20;

<figure><img src="/files/y8xrdP7ElVmg5o0PlO27" alt="" width="375"><figcaption><p>Trade Log's Stats Section</p></figcaption></figure>

## P\&L Section

The third section of the Trade Log computes your **P\&L**<mark style="color:purple;">**.**</mark>&#x20;

The first column (**% P\&L VS Current Price**) tells you in % terms how much higher or lower the current price is vis a vis the price transacted at (for each row / transaction). If the row registers a SELL event, the calculation is inverted, so that if the currenrt price is higher than the price you sold at, you will see a negative % P\&L. &#x20;

The second column (**$ P\&L VS Current Price**) uses that percentage and multiplies it by the $amount transacted, letting you know in $ terms how much you may have gained or lost. N.B: *These columns are purely for informational use and do not affect in any way the calculation of your account's P\&L.*&#x20;

Each time you SELL an asset you own, the  third and fourth columns display your final realized P\&L both in % terms and in $ terms  (proceeds of units sold minus cost of units sold). These figures also takes into account any fees you may have entered for this asset, both in the Fees column (when entering a  BUY or SELL event), or via the FEES entry (see box above). &#x20;

If you [set a secondary currency](/1/tracker/secondary-currency)**,** your P\&L will also be displayed in that secondary currency in the fifth column,  taking the exchange rate in effect *on the date you have entered in column A.*&#x20;

<figure><img src="/files/nkH9LaJNhTSQMA497ySm" alt="" width="563"><figcaption><p>Trade Log's  P&#x26;L Section</p></figcaption></figure>

## Sorting the Trade Log

You can **sort your trades** by header columns.  The main utility of this is the ability to add trades to to the Trade Log and not have to worry about entering them in perfect chronological order. You can simply add trades to the bottom of the list and then sort the list by dat&#x65;**,** and everything will then get computed correctly.

*Note that the Trade Log computes trades from **top to bottom,*** so trades MUST be *sorted* chronologically to be correctly computed. For example, you obviously can't sell something you have not already bought. But even if you do not *enter* them chronologically, you can simply ***sort*** ***by date*** and everything will recompute accordingly so long as the dates you have entered are correct.&#x20;

A good use case might be if you are using more than one exchange to trade Bitcoin, but want still want all these trades computed as one (say, for tax purposes). You want to know your P\&L and cost basis for Bitcoin ***across all Exchanges,*** not just on one exchange. Simply enter all your trades in the Trade Log and then sort by date and your costs basis and P\&L will be correctly computed across all exchanges, wallets, etc. (Use the Smol Formatter if you want to bulk import trades).

<figure><img src="/files/MdE8uCefWFsonzLCiMrX" alt=""><figcaption><p>Sorting your Trade Log by by date.</p></figcaption></figure>

h


# Holdings

Right below the **ROI chart**, you'll find the account's **Holdings table.**&#x20;

*This table is entirely auto-generated.* It will appear rowless until you begin entering trades in the Trade Log. A new row will be automatically added for each new asset you trade in one of your accounts. It will then pull live price data from [Yahoo Finance](https://finance.yahoo.com/) and [CoinMarketCap](https://coinmarketcap.com/) in order to give you rich metrics about your account:&#x20;

<figure><img src="/files/wMVsBJ6nVMkRMRjPqWIM" alt="Investment Tracker – Premium Templates for Apple Numbers."><figcaption><p>Automated Holdings Table</p></figcaption></figure>

1. **Ticker** (The asset codes you've entered in the [**Trade Log**](/1/smol_tracker/trade-log))
2. **Asset's name.** You can click these to be brought to the Asset's page on Yahoo Finance.
3. **Current Holdings** (number of units currently owned for each asset).
4. **Daily % Change** in price of the asset.
5. **Current Price** of the asset.
6. **Cost / Unit** (The total cost of your *current holdings* of the asset divided by the number of units *currently owned.* This is your current cost basis per unit.&#x20;
7. The price at which you **last transacted** this asset.&#x20;
8. Whether your **last transaction** of this asset was a BUY or a SELL.&#x20;
9. The **current value** of your holdings of this asset.&#x20;
10. The total **cost of your current holdings** for the asset (similar to 6.)
11. The current **$ amount gains or losses** on your *current holdings* of the asset.&#x20;
12. The current **% gains or losses** on your *current holdings* of the asset.&#x20;
13. Current R on your current holdings for this asset.
14. The **$ amount of realized gains or losses** for this asset. This is especially relevant for tax purposes.
15. The **$ amount of realized gains or losses** for this asset calculated in the secondary currency of your choice (if any). These amounts take into account the conversion rate on the day of each of your realized events so as to be as precise as possible. This is especially relevant for tax purposes.
16. The **Total $ Cost** for this asset: (*cost of current holdings* plus or minus any *realized gains or losses for this asset*)
17. The **Total $ Gains** for this asset: The current unrealized gains or losses plus the realized gains or losses for this asset.&#x20;
18. The **% share of your portfolio** this asset represents.&#x20;

{% hint style="info" %}
**Tip: Clickable asset names.**  You can now click on an asset' name in your Holdings, Portfolio Breakdown, Watchlists, etc. Doing so will bring you to the asset's page on Yahoo Finance where you can see live advanced charts (line, candles, bars),  relevant news, and  much more.  This works for all supported assets, and respect your selections in special assignations if you have made any.&#x20;

<img src="/files/vQigqrkcDQ9TChrHnqLC" alt="" data-size="original">
{% endhint %}

{% hint style="info" %}
While crypto price data is continually refreshed throughout the day, stocks prices are usually the most recent "close" price, i.e., the price of the asset at the end of the last trading day. Sadly, this is a current limitation imposed by Yahoo's own API. Hopefully continual live price updates will be forthcoming.&#x20;
{% endhint %}


# Changing the Primary Currency

## Changing the Currency Format

The Portfolio Tracker’s default currency is set to USD, but you can change the primary currency if you’re using a different base currency.\
For example, if you’re in Canada and trading in Canadian dollars, you can change the primary currency to CAD. Here’s how:

1. Open a new instance of the Tracker, go to any of the Account tabs  and click in cell <mark style="color:green;">**C2**</mark> in the Top Line Stats.
2. In the menu,  go to <mark style="color:green;">**View > Inspector > Format**</mark> to reveal the Sidebar.&#x20;
3. At the top of the sidebar, click on the **Cell** tab. The **Data Format**, should be set to "Smol Currency".  Click on "<mark style="color:green;">**Edit Custom Format**</mark>" &#x20;
4. In the modal that opens up, you'll see a number of rules, each starting with a <mark style="color:green;">**$**</mark> sign. Click on that sign and select the currency you want to use instead.&#x20;
5. Do this for each rule, then click OK.&#x20;

You'll notice that the currency of the Tracker has now been changed to display CA$ everywhere. &#x20;

<figure><img src="/files/2Dti1F2uuoayFZ7WCXi1" alt="Portfolio Tracker – Premium Templates for Apple Numbers."><figcaption><p>Change the currency format</p></figcaption></figure>

{% hint style="info" %}
If you find that this takes up too much space in your cells, you can go back and edit the format custom format "Smol Currency". You can get rid of the currency symbol altogether. &#x20;
{% endhint %}

### Video Walkthrough

{% embed url="<https://www.youtube.com/watch?v=0LOlgIz3se0>" %}
Video Guide&#x20;
{% endembed %}

## Trading in your local currency.&#x20;

**if you change the primary currency you'll want to enter trades for assets&#x20;*****denominated in your newly chosen primary currency.***&#x20;

***We recommend making***[ ***special assignations*** ](/1/how-to/stocks-listed-on-non-us-exchanges)***for each non-usd-denominated asset you trade.***&#x20;

For example, if I want to enter trades for **Bitcoin denominated in CAD**,  I'll specify in the Special Assignations table that the ticker "BTC" refers to the asset code "BTC-CAD". Doing so will ensure that the current price of Bitcoin is quoted in CAD. If I don't do this, the current value of my holdings will be denominated in USD, while your cost basis will be in CAD, which will produce an erroneous P\&L.

Similarly, if you are trading stocks of the Onex Corporation listed on a Canadian stock market, you'll want to enter its asset code next to the ticker you wish to use for it (in this case, ONEX). The Tracker will then remember that the ticker ONEX refers to stocks of the Onex Corporation denominated in Canadian dollars.

<figure><img src="/files/d2inmL95KZGq4MvfpZnh" alt="Trading assets in your local currency - Investment Tracker for Apple Numbers"><figcaption><p>Making Assignations for CAD denominated assets.</p></figcaption></figure>

{% hint style="info" %}
Special Assignations are optional. I could simply enter ONEX.TO directly in the Trade Log. The Special Assignation allows for a cleaner trade entry.&#x20;
{% endhint %}


# Optional Secondary Currency

### Optional Secondary Currency

The smol Portfolio Tracker allows you to easily set a secondary currency used to display important stats about your portfolio in a currency other than USD. This is especially useful if you need to keep track of your realized P\&L in a currency other than the USD for tax purposes.&#x20;

By default, the secondary currency is set to "CAD=X" which is the Canadian dollar.&#x20;

If you won't need stats in a secondary currency, select "None" from the pop-up menu.&#x20;

<figure><img src="/files/fL355IZpywUJ5tgYfb2S" alt="Alternative Currency - Apple Numbers" width="563"><figcaption><p>Choosing a secondary Currency</p></figcaption></figure>

Once set,  additional stats in that currency will show up on the rightmost column of the Top Line, and the currency you have selected will be displayed in <mark style="color:green;">C1</mark>.&#x20;

<figure><img src="/files/csXkUC7xnWkdHQkcQq6j" alt="Realized and Current Unrealized P&#x26;L displayed in CAD in addition to USD values."><figcaption><p>Realized and Current Unrealized P&#x26;L displayed in CAD in addition to USD values.</p></figcaption></figure>

<figure><img src="/files/tGU5OFUmbVqaJ5oXKxsm" alt="Holdings Table with Realized P&#x26;L in Alternative Currency Apple Numbers"><figcaption><p>Holdings Table with Realized P&#x26;L in Alternative Currency</p></figcaption></figure>

In the [**Trade Log**](/1/tracker/accounts#trade-log) the "**Realized P\&L (secondary)**" column will display your stats in that currency on to the right of the USD value.&#x20;

<figure><img src="/files/14S9xMqnYNEx5o86smjo" alt="Account&#x27;s P&#x26;L displayed in CAD in addition to USD" width="563"><figcaption><p>Account's P&#x26;L displayed in CAD in addition to USD</p></figcaption></figure>

#### Available Currencies

**Canadian Dollar** (USD/CAD)  [CAD=X](https://uk.finance.yahoo.com/quote/CAD%3DX?p=CAD%3DX) &#x20;

**British Pound** (USD/GBP)  [GBP=X](https://uk.finance.yahoo.com/quote/GBP%3DX?p=GBP%3DX) &#x20;

**Euro**  (USD/EUR)  [EUR=X](https://finance.yahoo.com/quote/EUR=X/)

**Euro Alt** (USD/EUR) [USDEUR=X](https://finance.yahoo.com/quote/USDEUR=X/)

**Hong Kong Dollar**  (USD/HKD)  [USDHKD=X](https://uk.finance.yahoo.com/quote/USDHKD%3DX?p=USDHKD%3DX) &#x20;

**Singapore Dollar**  (USD/SGD)  [USDSGD=X](https://uk.finance.yahoo.com/quote/USDSGD%3DX?p=USDSGD%3DX) &#x20;

**Japanese Yen** (USD/JPY)  [JPY=X](https://uk.finance.yahoo.com/quote/JPY%3DX?p=JPY%3DX)&#x20;

**Indian Rupee**  (USD/INR)  [INR=X](https://uk.finance.yahoo.com/quote/INR%3DX?p=INR%3DX)&#x20;

**Swiss Franc** (USD/CHF)  [CHF=X](https://uk.finance.yahoo.com/quote/CHF%3DX?p=CHF%3DX)&#x20;

**Chinese Yuan**  (USD/CNY)  [CNY=X](https://uk.finance.yahoo.com/quote/CNY%3DX?p=CNY%3DX) &#x20;

&#x20;**Russian Rouble** (USD/RUB)  [USDRUB=X](https://ca.finance.yahoo.com/quote/USDRUB%3DX?p=USDRUB%3DX)

**Mexican Peso**  (USD/MXN)  [USDMXN=X](https://uk.finance.yahoo.com/quote/USDMXN%3DX?p=USDMXN%3DX)&#x20;

**Philippine peso**  (USD/PHP)  [USDPHP=X](https://ca.finance.yahoo.com/quote/USDPHP%3DX?p=USDPHP%3DX) &#x20;

**Indonesian Rupiah**  (USD/IDR)  [USDIDR=X](https://ca.finance.yahoo.com/quote/USDIDR%3DX?p=USDIDR%3DX)&#x20;

**Thai Baht** (USD/THB)  [USDTHB=X](https://ca.finance.yahoo.com/quote/USDTHB%3DX?p=USDTHB%3DX)&#x20;

**Malaysian Ringgit**  (USD/MYR)  [USDMYR=X](https://ca.finance.yahoo.com/quote/USDMYR%3DX?p=USDMYR%3DX)&#x20;

**South African Rand**  (USD/ZAR)  [USDZAR=X](https://ca.finance.yahoo.com/quote/USDZAR%3DX?p=USDZAR%3DX)&#x20;

**Swedish Krona** (USD/ZEK)   [ZEK=X](https://finance.yahoo.com/quote/SEK=X?.tsrc=fin-srch)

**Australian Dollar** (USD/AUD)   [AUD=X](https://finance.yahoo.com/quote/AUD=X?.tsrc=fin-srch)

**New Zealand Dollar**  (USD/NZD)   [NZD=X](https://finance.yahoo.com/quote/NZD=X?.tsrc=fin-srch)

**Brazilian Real**  (USD/BRL)  [BRL=X](https://finance.yahoo.com/quote/BRL=X?.tsrc=fin-srch)

**United Arab Emirates Dirham** (USD/AED)   [AED=X](https://finance.yahoo.com/quote/AED=X?.tsrc=fin-srch)

**Israeli New Shekel** (USD/ILS)  [ILS=X](https://finance.yahoo.com/quote/ILS=X?.tsrc=fin-srch)

**South Korean Won**  (USD/KRW)   [KRW=X](https://finance.yahoo.com/quote/KRW=X?.tsrc=fin-srch)

**Turkish Lira**  (USD/TRY)   [TRY=X](https://finance.yahoo.com/quote/TRY=X?.tsrc=fin-srch)

**Saudi Riyal**   (USD/SAR)   [SAR=X](https://finance.yahoo.com/quote/SAR=X?.tsrc=fin-srch)

**Egyptian Pound**  (USD/EGP)    [EGP=X](https://finance.yahoo.com/quote/EGP=X?.tsrc=fin-srch)

**Danish Krone** (USD/DKK)   [DKK=X](https://finance.yahoo.com/quote/DKK=X?.tsrc=fin-srch)

**Argentine Peso**   (USD/ARS)    [ARS=X](https://finance.yahoo.com/quote/ARS=X?.tsrc=fin-srch)

**Bulgarian Lev**  (USD/BGN)  [BGN=X](https://finance.yahoo.com/quote/BGN=X?.tsrc=fin-srch)

**Polish Złoty**   USD/PLN   [PLN=X](https://finance.yahoo.com/quote/PLN=X?.tsrc=fin-srch)

**Czech Koruna**  (USD/CZK)  [CZK=X](https://finance.yahoo.com/quote/CZK=X?.tsrc=fin-srch)

**New Taiwan Dollar**   (USD/TWD)  [TWD=X](https://finance.yahoo.com/quote/TWD=X?.tsrc=fin-srch)


# Troubleshooting

If you encounter issues with your Portfolio Tracker,  please make sure you are using the current version of Numbers as updating and opening a fresh copy of the Portfolio Tracker is likely to resolve the issues. &#x20;

If the Holdings Table are registering the wrong assets or showing error symbols, make sure that you have selected the correct[ account type](/1/tracker/accounts#account-type) (Stocks or Crypto). &#x20;

If the asset name and price still don't match the ticker you are trading, you can fix this by making a [Special Assignation](/1/how-to/confused-asset-codes).

[Fixing an **erroneous asset match** in your Holdings](/1/how-to/confused-asset-codes)

If you are still encountering an issue or think you have found a bug, please [reach out ](< https://smolcompute.xyz/contact>)so we can fix it or try to help you.&#x20;


# Formatter


# Quick Start

## 🪜 Steps

This tool is pretty straightforward to use:

1. Download your trades (csv or xlsx file) from your exchange(s).
2. Copy everything *but* the header row.
3. In the smol Formatter, go to the sheet labeled with the name of the exchange and paste everything in the first table. The formatter spits out your reformatted trades in the second table.
4. Quickly make sure everything looks good.
5. Copy everything in the second table and **paste formula results (Cmd+Shift+F)** into the **🗂TRADE LOG.**
6. In the Trade Log click on the header of the “Date” column, and choose **“Sort Ascending”.** This will make sure all your trades are sorted chronologically. This is important as the order of your trades affects the computation of your cost basis and PnL calculation (e.g., you obviously can’t sell something you haven’t already bought, so the smol Portfolio Tracker will display an error if your trades are not ordered chronologically). Once you’ve done that, you add them to your Portfolio Tracker.
7. When you are done, delete the data in the first table.&#x20;

{% hint style="danger" %}
Never delete anything in the second table as you will delete formulas.&#x20;

The table will reset itself when you wipe the first table clean.&#x20;
{% endhint %}

## ☝️Best Practices

{% hint style="info" %}

### Regularity

How often you export your trades is entirely up to you and should match your trading style. If you are more of a "buy and hold" type of trader, maybe you only need to update your portfolio every couple months. If you trade everyday, perhaps you will want to update your portfolio once every morning, or once every night. I personally do it every Monday.&#x20;

Whatever you choose, I recommend picking a routine and sticking to it as regularity can simplify things. You can, for example, choose the **"Yesterday",** or the **"Last Month"** option on export, which will save you the trouble of manually checking where you last export ended.&#x20;
{% endhint %}

{% hint style="info" %}

### The Trade Log

The 🗂 **TRADE LOG** is a great place to… log your full, multi-year trading history (for all exchanges).

I highly recommend against using the exchange's sheet as a place to keep your full trading history as it contains live formulas. It's best practices to reformat new trades when you export them from your exchange, add these new trades to your TRADE LOG, and wipe the exchange's sheet clean when you are done. &#x20;

If your trades are already sorted chronologically, you can of course choose to skip the TRADE LOG and simply paste formula results into the smol Portfolio Tracker. However, I still recommend getting into the habit of adding your trades to the TRADE LOG as it can serve as a useful backup.
{% endhint %}


# Video Guides

## Animated Demo

{% embed url="<https://youtu.be/c1ZlTj9bJvI>" %}


# Troubleshooting

If you encounter issues with your Portfolio Tracker,  please make sure you are using the current version of Numbers as updating and opening a fresh copy of the smol Formatter  is likely to resolve the issues. &#x20;

If you are still encountering an issue or think you have found a bug, please [reach out ](< https://smolcompute.xyz/contact>)so we can fix it or try to help you.&#x20;


# General Guides


# Tips and Tricks

{% hint style="success" %}
**Tip:**   A quick way to enter <mark style="color:green;">the</mark> <mark style="color:green;"></mark>*<mark style="color:green;">exact date and time</mark>* in your Trade Log is via the application's menu.&#x20;

Go to **Table > Insert Current Time** (this will enter *both* the date and the time down to the second). &#x20;

Even quicker:  hit  **Control - Shift - Command - T**
{% endhint %}

{% hint style="success" %}
**⭐️ Pro Tip:**&#x20;

To simplify and accelerate things you can customize Numbers' shortcuts.&#x20;

<mark style="color:green;">We recommend reassigning</mark> <mark style="color:green;"></mark><mark style="color:green;">**⌘ - D**</mark>  <mark style="color:green;"></mark><mark style="color:green;">to</mark> <mark style="color:green;"></mark>*<mark style="color:green;">Insert Current Time</mark>*  to make entering the exact date and time in your Trade Log a breeze.&#x20;

<mark style="color:green;">Consider reassigning</mark> <mark style="color:green;"></mark><mark style="color:green;">**⌘ - V**</mark>  <mark style="color:green;"></mark><mark style="color:green;">to</mark>  <mark style="color:green;"></mark>*<mark style="color:green;">Paste and Match Style (only in Numbers).</mark>* &#x20;

Most often when you paste data into the Portfolio Tracker,  you want to *match the destination cell's style* rather than retain the provenance's formatting.  If you find it cumbersome to use the default shortcut (**Shift -Option- ⌘ - V**), consider switching it simply to <mark style="color:green;">**⌘ - V**</mark>**&#x20;only for Numbers.**&#x20;**&#x20;This will not affect other applications.** To regular paste, you can then use the menu, or add a different shortcut.&#x20;

This is done form the Keyboard tab inside Mac OS's System Settings.&#x20;

Go into App Shortcuts, press the + sing at the bottom of the list and select Numbers instead of All Applications in the dialogue.&#x20;

<img src="/files/lQfB5phHOccqmA4dK84n" alt="" data-size="original">
{% endhint %}

{% hint style="success" %}
**Tip:**  Keep the original zip file somewhere in case you need to reset the portfolio (e.g., if you accidentally deleted formulas and can't undo for some reason). You can easily [copy and paste your trading data](/1/how-to/data-migration) into a fresh copy of the Portfolio Tracker. If you need to, you can always re-download the latest version of the Portfolio Tracker from the smol compute store.&#x20;
{% endhint %}

## Useful Keyboard Shortcuts

#### Useful Standard Numbers Shortcuts

[Add rows to a table](#add-rows-to-tables): press **Return** while having a cell selected in the last available row.&#x20;

[Paste Formula Results:](#paste-formula-results)  **Shift - ⌘ - V**

[Paste and Match Style](#paste-and-match-style): **Shift -Option- ⌘ - V**

Insert Current Date & Time:   **Control - Shift - Command - T**

Unlock an element:  **Option - ⌘ - L**

Lock an element:  **⌘ - L**

Highlight the row and column for a cell:  Press **Option** as you move over a cell

Numbers has [shortcuts for just about anything.](https://support.apple.com/en-ca/guide/numbers/tana45192591/mac)

## Add Rows to Tables

{% hint style="warning" %}
Please note that you do not need to add rows to the [Holdings](/1/smol_tracker/holdings) table nor to the [Portfolio Breakdown](/1/tracker/dashboard#portfolio-breakdown) table. New rows will automatically appear in these tables when needed.&#x20;
{% endhint %}

There might be time when you need to add some rows to the different tables of our tools.&#x20;

The best way to add rows to a table with preserving the formulas is to simply select a cell in the last row, then press **Return.** &#x20;

**Example:** &#x20;

I need more rows in the Snapshots table. I select a cell in the last available row (excluding the footer), and simply hit **enter.**&#x20;

<figure><img src="/files/geiMaSYD1nWnvAGtLSzR" alt="" width="563"><figcaption><p>Adding rows to the Snapshot Table</p></figcaption></figure>

## Pasting Data into the Portfolio Tracker

Most often, when pasting values into the smol Portfolio Tracker, you will either want to *<mark style="color:green;">Paste and Match Style</mark>*  or *<mark style="color:green;">Paste Formula Results</mark>*.  We recommend you learn the shortcuts for both as it will speed things up for you.&#x20;

#### Paste Formula Results:  <mark style="color:green;">**Shift - ⌘ - V**</mark>&#x20;

When making a snapshot by copying and pasting the "Current Values" in the Snapshot table, you want to *Paste Formula Results,* since it is the values (the "results")  you want to paste and not the formula itself.&#x20;

<figure><img src="/files/yavrNlNSiK5dJO2QyWxq" alt="" width="563"><figcaption><p>Pasting Formula Results</p></figcaption></figure>

#### Paste and Match Style:   <mark style="color:green;">**Shift -Option- ⌘ - V**</mark>    &#x20;

If you just want to paste values you have copied either from a previous version of the smol Portfolio Tracker, or from some other source, using *Paste and Match Style* will paste these values *while retaining the style defined by the color theme you have chosen.* &#x20;

## Annual Reset

For more active traders, we recommend archiving your Portfolio Tracker at [EOY ](#user-content-fn-1)[^1]and starting each new year with a fresh copy.&#x20;

For each asset you still owned at EOY, enter a BUY entry in the new copy of the Portfolio Tracker, with the quantity you own and using your current "Cost / Unit" as the price.&#x20;

Performing this reset can help keep things snappy and running smoothly if you have hundreds or thousands of trades in your accounts. It's also great records-keeping as each tax year will be neatly and conveniently archived and separated from others.  The **"Realized P\&L"** on the [**Dashboard** ](/1/tracker/dashboard)and on the [**Top Line Stats** ](/1/tracker/accounts#top-line-sats)of each account will then give you the realized profits and losses only for the ongoing tax year, while your total Portfolio's P\&L will account for the whole appreciation or depreciation of your portfolio across years.

## A Note on Plumbing

The Portfolio Tracker has a number of hidden columns performing important calculations in the background. These columns, though hidden by default,  are generally <mark style="color:purple;">**bright purple**</mark> and labeled "Plumbing", so you'll know right away if you've accidentally unhid some of them and you'll be able to easily identify them if you are making some customizations to the Tracker . You can keep them hidden, but beware that deleting them will affect the functionality of the Tracker!

<figure><img src="/files/RuEEIJoAYV3NG5GPmOiL" alt=""><figcaption><p>Example of normally hidden "Plumbing" columns differentiated by the color purple. </p></figcaption></figure>

[^1]: End of Year


# Fixing an Erroneous Asset Match

Quickly fix an Erroneous Asset Match

## Fixing Crypto Assets

(see [here ](/1/how-to/stocks-listed-on-non-us-exchanges)to handle non-US listed stocks)

smol compute builds on top of Apple's native integration of Yahoo Finance data, ensuring robust and accurate price feeds are used for your portfolio. The crypto data integration is also powered by Yahoo Finance with live prices provided by CoinMarketCap. This allows us to support virtually all stocks, ETFs, coins, and tokens.

The Smol Tracker automatically matched tickers to assets, however, Yahoo sometimes uses irregular asset codes which could lead to issues. For example, the asset code for Uniswap is "UNI7083" rather than simply "UNI".  This can happen since, in crypto, it is possible for more than one coin to share the same **asset code** (ticker). &#x20;

So that you don't have to worry about these irregular asset codes, <mark style="background-color:green;">smol compute automatically resolves irregular asset codes for the top 500 assets listed on CoinMarketCap / Yahoo.</mark> So you can simply enter "UNI" in your Trade Log and smol compute will know to match this ticker to the Uniswap asset (and provide you with accurate price data for it).&#x20;

#### For Edge Cases: Use the Special Assignations widget

If you are trading exotic micro cap assets with irregular asset codes (who are we to judge!),  you can quickly specify which asset should be matched to a ticker in the "**Special  Assignations**" widget situated in the sidebar (to the right). You'll see "DMT" already listed as an example.&#x20;

**Let's walk through the example.**

Say I just entered a trade for an asset called "[Sanko GameCorp](https://finance.yahoo.com/quote/DMT25653-USD)" using the ticker "DMT" in my Trade Log.  Yahoo happens to use an irregular asset code for this asset so the ticker DMT is not being matched to the right asset (it's showing as "Dmarket" in my Holdings).&#x20;

<figure><img src="/files/AWFUeW9iKCSHpndoyrUQ" alt="" width="563"><figcaption><p>Erroneous Asset Match for DMT</p></figcaption></figure>

In the Special Assignation widget, I enter the ticker I want to use in column <mark style="color:green;">A</mark> (DMT). I then click in the cell immediately to the right (in the Code column), and in the application's menu, I go to <mark style="color:green;">Insert > Formula > Stock Quote</mark>.  This will bring up a pop up with a search field  where I can simply start typing the name of the asset I want to assign to the ticker :

<figure><img src="/files/fwEa7tBHQr0Y4nwuoj0g" alt=""><figcaption><p>Searching for my asset</p></figcaption></figure>

I can then select the correct asset by clicking on it. Finally, I need to make sure I choose "Symbol" rather than "Price" in the pop-up:

<figure><img src="/files/b5AbifC9KlfKvW6NsG3X" alt=""><figcaption><p>Selecting "Symbol" in the dialogue</p></figcaption></figure>

That's it! Immediately, the correct name for the asset is displayed, along with its price.&#x20;

The special assignation as been made. Now the tracker will know to match the ticker "DMT" to the Sanko GameCorp asset. I can see that the correct asset now displays in my Holdings table.&#x20;

<figure><img src="/files/dDnLkFSlrGNaZE692Dyy" alt=""><figcaption><p>Special Assignation for DMT</p></figcaption></figure>

Another way of making the assignation is simply by finding out  what asset code Yahoo actually uses for the Asset I want to trade by going directly to [Yahoo's cryptocurrency listings ](https://finance.yahoo.com/crypto/?count=100)and searching for "Sanko GameCorp". The asset code appears in blue above the asset name. I can then simply paste the  asset code right next to the ticker to make my assignation without having to go through the pop-up.&#x20;

<figure><img src="/files/WRApDpWuz5J064MZNKoz" alt=""><figcaption><p>Finding the Asset Code on finance.yahoo.com</p></figcaption></figure>


# Stocks Listed on Non-US Exchanges

How to handle Stocks Listed on Non-US Exchanges

If an asset is listed on **Yahoo Finance**, it's supported by your smol trading tools .&#x20;

For US listed securities, simply entering the ticker you are trading (e.g., AAPL) will automatically identify the correct asset.&#x20;

For securities listed on exchanges *outside of the US<mark style="color:purple;">,</mark>* you may need to add the [suffix Yahoo has assigned to the exchange](/1/how-to/supported-non-us-stock-exchanges) (e.g., GLXY.**TO** will be recognized as a stock listed on the Toronto Stock Exchange, in this case Galaxy Digital Holdings).

If you don't want to have to use a ticker with a suffix in your Trade Log, you can make a <mark style="color:green;">special assignation.</mark> For example, if I want to simply use GLXY in my Trade Log, I'll go to the Special Assignations table,  enter GLXY in column A and GLXY.TO in column B. &#x20;

I can also search for the correct asset code without having to look it up on Yahoo's site: click in the cell in column B and go to  <mark style="color:green;">Insert > Formula > Stock Quote</mark>.  This will bring up a pop up with a search field  where I can simply start typing the name of the asset I want to assign to the ticker. Select the correct asset, then I make sure I choose "Symbol" rather than "Price" in the pop-up.

<figure><img src="/files/HpliVywCGy64qZNEvRTD" alt=""><figcaption></figcaption></figure>

The special assignation as been made. I can now enter trades for GLXY as I normally would, and the tracker will know to match the ticker "GLXY" to the Galaxy Digital Holdings asset. I can see that the correct asset now displays in my Holdings table.&#x20;

<figure><img src="/files/qIPOM6rQOpKUShjgoByr" alt=""><figcaption><p>Special Assignation for GLXY</p></figcaption></figure>

{% hint style="warning" %}
If you are trading securities that are not denominated in USD, you may want to [change your portfolio's primary currency. ](/1/tracker/changing-the-primary-currency)
{% endhint %}


# Crypto to Crypto Trades

In most jurisdictions, crypto-to-crypto trades are treated as disposals. So if you buy TURBO with ETH, you trigger a taxable event on the ETH you used to purchase TURBO — as though you had first sold it for USD and then used that USD to buy TURBO.

When doing crypto to crypto trades, we recommend entering two separate events in the Trade Log.&#x20;

Say you bought some ETH some time ago and entered that trade in the Trade Log. When you now use it to purchase TURBO, I would enter:

1. A SELL event for the amount of ETH you used to buy TURBO, using the current price of ETH.
2. A BUY event for the amount of TURBO you received for your ETH (the price of TURBO should be the USD value of the previous transaction divided by the amount of TURBO you purchased)

Doing it like this ensures that your ETH balance stays accurate and that you’re logging the realized P\&L when you swapped it for TURBO.

The [Formatter](/1/formatter) can also help you convert trades bought with ETH, BNB, SOL, and BTC into USD denominated trades.&#x20;


# Data Migration

Here's a Checklist to Import Data into a New Version or Theme

There may be times when you need to migrate data from one instance of the Portfolio Tracker to another (e.g., when you update to a new version or if you decide to change color theme). When this is the case, please follow this simple checklist.&#x20;

1. Open both instances of the Portfolio Tracker and place them side to side (the one you are migrating from and the one you are migrating to.)
2. Go to your first Account and select all the trades in the Trade Lo&#x67;**,** making sure to select *all and only* the data you have entered in the *lighter cells*. Hit <mark style="color:green;">**⌘ + C**</mark>**.**
3. Go to the Trade Log of Account 1 in the new instance of the Tracker. Click on the cell **A3** and hit **Shift + ⌘ + V** (Paste and Match Style). All your trades will appear and the Tracker will recompute everything.  Make sure to select the right [Account Type](/1/tracker/accounts#account-type) (Crypto or Stocks) in <mark style="color:green;">B1</mark> of the account's Top Line Stats.&#x20;
4. Do the same thing for the [Snapshot](/1/tracker/accounts#snapshots) table, each time making sure to select only the data you entered in the *lighter cells* and pasting this data using  <mark style="color:green;">**Shift + ⌘ + V**</mark> (Paste and Match Style).&#x20;
5. Follow the same procedure (steps 2 to 4) for each one of your active accounts.&#x20;
6. If you had a secondary currency set, [reset it ](/1/tracker/secondary-currency)in the new instance.&#x20;

{% hint style="warning" %}
If you had a lot of data to migrate, you will want to make sure you have enough rows in the destination table (e.g., new Trade Log). To add rows, simply select the last row and press Enter, or drag the edge of the table (the small circle) down.&#x20;
{% endhint %}

<figure><img src="/files/GAgpBlKAko7hCLt8ORlv" alt="Data Migration"><figcaption><p>Data Migration</p></figcaption></figure>


# Adding Accounts

How to add Accounts to your Portfolio

### 1. Add an Account Sheet

Right-click on the tab of ACCOUNT 3 and select "Duplicate" in the contextual menu.&#x20;

Rename the new duplicated sheet to "ACCOUNT 4"

<figure><img src="/files/2FfsUo58LoPvXVBUPHVX" alt=""><figcaption></figcaption></figure>

### 2. Add the new account to the Dashboard

Go to the **Dashboard** and scroll down to the **Portfolio Breakdow**n. With the table selected, go to the application menu and select **View > Inspector > Organize**  to reveal the organize options in the sidebar.&#x20;

Under the **Filter** tab of the sidebar, toggle the filters off.  This will unhide all the rows of the table.&#x20;

Now scroll down to ACCOUNT 3.  Right-click on ACCOUNT 3 and select "Add Group Below" in the contextual menu.&#x20;

Rename the new group to "ACCOUNT 4"

<figure><img src="/files/CmRqPqiDMSfcFU3UrP08" alt=""><figcaption></figcaption></figure>

### 3. Edit the formulas in the row under ACCOUNT 4

Now you have to edit the formulas in the row that was just created when you added a new group to the table. To edit a cell's formula, double click in the cell to bring up the formula's pop up editor. To edit a part of the formula, double click on the part of the formula you want to edit.&#x20;

**In the very first cell** **of the row (A 302)**, change the formula to :&#x20;

`ACCOUNT 4::PLUMBING HOLDINGS::A3`

**In the second cell (B 302)** enter :&#x20;

`IF(A≠"",XLOOKUP(A,ACCOUNT 4::PLUMBING HOLDINGS::A,ACCOUNT 4::PLUMBING HOLDINGS::D,"",0),"-")`

**In all the other cells**, simply change `ACCOUNT 3` to `ACCOUNT 4` everywhere.  Some cells have no reference to ACCOUNT 3 and do not need any changes.&#x20;

<figure><img src="/files/KU1LBvVbyQQrzLrOGsyK" alt=""><figcaption></figcaption></figure>

### 4. Add rows to ACCOUNT 4&#x20;

1. &#x20;In the application menu,  select **View > Inspector > Format**  to reveal the Format Sidebar.&#x20;
2. In the Table tab of the sidebar, under **Rows** enter the value **407**. This will add rows to your new account.&#x20;
3. Go back to **View > Inspector > Organize**  and toggle the filters back on.  This will hide all the unnecessary rows in your account to keep things tidy.&#x20;


# Getting Updates

When an update for a product you purchased is released, you will receive an email to the address you used at the time of purchase inviting you to download the new version of the product.&#x20;

To migrate to a new version, follow these [simple instructions](/1/how-to/data-migration).&#x20;

To be notified of any updates to smol compute products, you can sign up to our mailing list.&#x20;

{% @mailchimp/mailchimpSubscribe cta="Sign up to receive updates!" %}


# What devices can I use smol compute on?

How do I use smol compute in the browser?

Our products are designed for [Apple Numbers](https://www.apple.com/numbers/). Numbers is accessible on [the Mac](https://support.apple.com/en-ca/guide/numbers/welcome/mac), on[ iPads](https://support.apple.com/en-ca/guide/numbers-ipad/welcome/ipados),  on [iPhones](https://support.apple.com/en-ca/guide/numbers-iphone/welcome/ios) and on the [Vision Pro](https://support.apple.com/en-ca/guide/apple-vision-pro/tanc022cf47c/visionos).  Running Numbers natively on device will yield the best performance.&#x20;

<figure><img src="/files/rbE443MLqq38OdZO2usL" alt="Using smol compute on iPad"><figcaption></figcaption></figure>

<figure><img src="/files/u5tjZwAoUSz33tgPXqxz" alt="" width="375"><figcaption></figcaption></figure>

## Using smol compute in the Browser (Numbers Web App)

&#x20;Yu can also access Numbers and your Portfolio in a [browser](https://www.icloud.com/numbers) [here](https://www.icloud.com/numbers). &#x20;

You will need to create an iCloud account. This is similar to using Google Sheets and Excel online.

You can retain full privacy (end-to-end encryption) while accessing your portfolio in the browser. You will need a trusted device to enable the local decryption of your portfolio:

#### Advanced Data Protection and iCloud.com web access

When a user first turns on [Advanced Data Protection](/1/how-to/turning-on-end-to-end-encryption), web access to their data at iCloud.com is automatically turned off. This is because iCloud web servers no longer have access to the keys required to decrypt and display the user’s data. The user can choose to turn on web access again, and use the participation of their trusted device to access their encrypted iCloud data on the web.

After turning on web access, the user must authorize the web sign-in on one of their trusted devices each time they visit iCloud.com. The authorization “arms” the device for web access.&#x20;

<figure><img src="/files/YFgqBDjWfeZFbRudWSlk" alt="Numbers Web App on iCloud"><figcaption><p>Numbers Web App on iCloud</p></figcaption></figure>

<figure><img src="/files/Oup9AnsT3c63uA91WDkS" alt="Use smol compute Portfolio Manager in the Browser"><figcaption><p>Use smol compute Portfolio Manager in the Browser</p></figcaption></figure>

You can read more about using Numbers as a web app on [Apple's site](https://support.apple.com/en-ca/guide/numbers-icloud/welcome/14.0/icloud).&#x20;


# Turning on End-to-End Encryption

How to sync your portfolio across your devices while retaining full privacy.

<figure><img src="/files/HvJ4V26syArVB5zdDMRB" alt=""><figcaption></figcaption></figure>

You can sync your Portfolio Tracker across your devices in a fully-private manner by using end-to-end encryption for iCloud documents. Apple calls this feature "Advanced Data Protection". &#x20;

See [this guide](https://support.apple.com/en-us/108756) to find out how to turn it on.&#x20;

## What is Advanced Data Protection for iCloud ?

Advanced Data Protection for iCloud is an optional setting that offers Apple’s highest level of cloud data security. <mark style="background-color:green;">When a user turns on Advanced Data Protection, their trusted devices retain sole access to the encryption keys for the majority of their iCloud data, thereby protecting it with</mark> <mark style="background-color:green;"></mark>*<mark style="background-color:green;">end-to-end encryption</mark>*<mark style="background-color:green;">.</mark>&#x20;

## How to turn on Advanced Data Protection for iCloud

You can turn on Advanced Data Protection on an iPhone with iOS 16.2, iPad with iPad OS 16.2, or a Mac with macOS 13.1. Turning on Advanced Data Protection on one device enables it for your entire account and all your compatible devices.

#### On iPhone or iPad

1. Open the Settings app.
2. Tap your name, then tap iCloud.
3. Scroll down, tap Advanced Data Protection, then tap Turn on Advanced Data Protection.
4. Follow the onscreen instructions to review your recovery methods and enable Advanced Data Protection.

#### On Mac

1. Choose Apple menu  > System Settings.
2. Click your name, then click iCloud.
3. Click Advanced Data Protection, then click Turn On.
4. Follow the onscreen instructions to review your recovery methods and enable Advanced Data Protection.

## How Advanced Data Protection Works

When the user turns on Advanced Data Protection, their trusted device performs two actions: First, it communicates the user’s intent to turn on Advanced Data Protection to their other devices that participate in end-to-end-encryption. It does so by writing a new value, signed by device-local keys, into its iCloud Keychain device metadata. Apple servers can’t remove or modify this attestation while it gets synchronized with the user’s other devices.

Second, the device initiates the removal of the *available-after-authentication* service keys from Apple data centers. As these keys are protected by iCloud HSMs, this deletion is immediate, permanent, and irrevocable. <mark style="background-color:green;">After the keys are deleted, Apple can no longer access</mark> <mark style="background-color:green;"></mark>*<mark style="background-color:green;">any</mark>* <mark style="background-color:green;"></mark><mark style="background-color:green;">of the data protected by the user’s service keys.</mark> At this time, the device begins an asynchronous key rotation operation, which creates a new service key for each service whose key was previously available to Apple servers. If the key rotation fails, due to network interruption or any other error, the device retries the key rotation until it’s successful.

After the service key rotation is successful, new data written to the service can’t be decrypted with the old service key. It’s protected with the new key which is controlled solely by the user’s trusted devices, and was never available to Apple.

## Accessing your portfolio in the browser

When a user first turns on [Advanced Data Protection](/1/how-to/turning-on-end-to-end-encryption), web access to their data at iCloud.com is automatically turned off. This is because iCloud web servers no longer have access to the keys required to decrypt and display the user’s data. The user can choose to turn on web access again, and use the participation of their trusted device to access their encrypted iCloud data on the web.

After turning on web access, the user must authorize the web sign-in on one of their trusted devices each time they visit iCloud.com. The authorization “arms” the device for web access.&#x20;

## Sharing you Portfolio

Advanced Data Protection is designed to maintain end-to-end encryption for shared content as long as all participants have Advanced Data Protection enabled. This level of protection is supported in most iCloud sharing features, including  iCloud Drive shared folders.&#x20;

iWork collaboration and sharing content with “anyone with the link,” don’t support Advanced Data Protection. This means the shared content is not end-to-end encrypted even when Advanced Data Protection is enabled.&#x20;

<mark style="background-color:green;">If you want to give someone access to your portfolio in a fully private manner, we recommend placing the Numbers file inside a shared iCloud folder and making sure both parties have  Advanced Data Protection enabled.</mark>&#x20;


# Modifying your smol Tools

## Unlocking Locked Elements

In order to avoid involuntary edits, certain elements of our products are locked by default when basic functionality does not require the user interact with them.&#x20;

You are, of course, free to modify our smol tools in any way you like. &#x20;

{% hint style="info" %}
**To unlock an element, simply select it and hit Option - ⌘ - L**
{% endhint %}


# Sharing & Collaboration

What are the privacy implications of sharing and collaborating on Numbers Documents.

You can collaborate with others in real time by sharing a link to your Numbers for iCloud spreadsheet. Shared spreadsheets and any changes to them are saved in iCloud, so everyone working on the spreadsheet sees the changes as they’re made.

As the owner of the spreadsheet, you choose who can:

* *Access the spreadsheet:* Create a link that anyone can use to open the spreadsheet, or limit access to only specific people who must sign in with their [Apple ID](https://support.apple.com/en-ca/guide/numbers-icloud/aside/gildb677e8eb/14.0/icloud/1.0) before they can open it.
* *Edit or only view the spreadsheet:* Choose whether to give others permission to make changes to the spreadsheet, or only view it.
* *Invite others to collaborate:* Choose whether the people you invite can also invite other people to join the spreadsheet.

Read more about this on[ Apple's site](https://support.apple.com/en-ca/guide/numbers-icloud/gil99ded7d5b/14.0/icloud/1.0).

### Security & Privacy implications of sharing and collaboration

In most cases, when users share content—for example, with shared Numbers documents—and all the users have[ Advanced Data Protection](/1/how-to/turning-on-end-to-end-encryption) turned on, Apple servers are used only to establish sharing but don’t have access to the encryption keys for the shared data. The content remains end-to-end encrypted and accessible only on participants’ trusted devices. For each sharing operation, a title and representative thumbnail may be stored by Apple with standard data protection to show a preview to the receiving users.

<mark style="background-color:green;">Selecting the “anyone with a link” option when enabling collaboration will make the content available to Apple servers under standard data protection, as the servers need to be able to provide access to anyone who opens the URL.</mark>

iWork **collaboration** don’t support Advanced Data Protection. When users collaborate on an iWork document, or open an iWork document from a shared folder in iCloud Drive, the encryption keys for the document are securely uploaded to iWork servers in Apple data centers. This is because real-time collaboration in iWork requires server-side mediation to coordinate document changes between participants. Photos added to Shared Albums are stored with standard data protection, as the feature permits albums to be publicly shared on the web.<br>


# Supported Non-US Stock Exchanges

This list is not exhaustive and is provided purely for reference. When trading stocks listed on non-US stock exchanges, you'll want to use asset codes with the correct **suffix**. See [here](/1/how-to/stocks-listed-on-non-us-exchanges) to learn more.

<table><thead><tr><th>Country</th><th width="186">Market, or Index</th><th width="128">Suffix</th><th width="118">Delay</th><th>Data Provider</th></tr></thead><tbody><tr><td>United States of America</td><td>Cboe Indices</td><td>N/A</td><td>15 min</td><td>ICE Data Services</td></tr><tr><td>United States of America</td><td>Chicago Board of Trade (CBOT)***</td><td>.CBT</td><td>10 min</td><td>ICE Data Services</td></tr><tr><td>United States of America</td><td>Chicago Mercantile Exchange (CME)***</td><td>.CME</td><td>10 min</td><td>ICE Data Services</td></tr><tr><td>United States of America</td><td>Dow Jones Indexes</td><td>N/A</td><td>Real-time</td><td>ICE Data Services</td></tr><tr><td>United States of America</td><td>Nasdaq Stock Exchange</td><td>N/A</td><td>Real-time</td><td>ICE Data Services</td></tr><tr><td>United States of America</td><td>ICE Futures US</td><td>.NYB</td><td>30 min</td><td>ICE Data Services</td></tr><tr><td>United States of America</td><td>New York Commodities Exchange (COMEX)***</td><td>.CMX</td><td>30 min</td><td>ICE Data Services</td></tr><tr><td>United States of America</td><td>New York Mercantile Exchange (NYMEX)***</td><td>.NYM</td><td>30 min</td><td>ICE Data Services</td></tr><tr><td>United States of America</td><td>Options Price Reporting Authority (OPRA)</td><td>N/A</td><td>15 min</td><td>ICE Data Services</td></tr><tr><td>United States of America</td><td>OTC Markets Group**</td><td>N/A</td><td>15 min</td><td>ICE Data Services</td></tr><tr><td>United States of America</td><td>S &#x26; P Indices</td><td>N/A</td><td>Real-time</td><td>ICE Data Services</td></tr><tr><td>Argentina</td><td>Buenos Aires Stock Exchange (BYMA)</td><td>.BA</td><td>30 min</td><td>ICE Data Services</td></tr><tr><td>Austria</td><td>Vienna Stock Exchange</td><td>.VI</td><td>15 min</td><td>ICE Data Services</td></tr><tr><td>Australia</td><td>Australian Stock Exchange (ASX)</td><td>.AX</td><td>20 min</td><td>ICE Data Services</td></tr><tr><td>Australia</td><td>Cboe Australia</td><td>.XA</td><td>Real-time</td><td>ICE Data Services</td></tr><tr><td>Belgium</td><td>Euronext Brussels</td><td>.BR</td><td>15 min</td><td>ICE Data Services</td></tr><tr><td>Brazil</td><td>Sao Paolo Stock Exchange (BOVESPA)</td><td>.SA</td><td>15 min</td><td>ICE Data Services</td></tr><tr><td>Canada</td><td>Canadian Securities Exchange</td><td>.CN</td><td>Real-time</td><td>ICE Data Services</td></tr><tr><td>Canada</td><td>Cboe Canada</td><td>.NE</td><td>Real-time</td><td>ICE Data Services</td></tr><tr><td>Canada</td><td>Toronto Stock Exchange (TSX)</td><td>.TO</td><td>Real-time</td><td>ICE Data Services</td></tr><tr><td>Canada</td><td>TSX Venture Exchange (TSXV)</td><td>.V</td><td>Real-time</td><td>ICE Data Services</td></tr><tr><td>Chile</td><td>Santiago Stock Exchange</td><td>.SN</td><td>15 min</td><td>ICE Data Services</td></tr><tr><td>China</td><td>Shanghai Stock Exchange</td><td>.SS</td><td>30 min</td><td>ICE Data Services</td></tr><tr><td>China</td><td>Shenzhen Stock Exchange</td><td>.SZ</td><td>30 min</td><td>ICE Data Services</td></tr><tr><td>Colombia</td><td>Colombia Stock Exchange</td><td>.CL</td><td>20 min</td><td>ICE Data Services</td></tr><tr><td>Czech Republic</td><td>Prague Stock Exchange Index</td><td>.PR</td><td>20 min</td><td>ICE Data Services</td></tr><tr><td>Denmark</td><td>Nasdaq OMX Copenhagen</td><td>.CO</td><td>Real-time</td><td>ICE Data Services</td></tr><tr><td>Egypt</td><td>Egyptian Exchange Index (EGID)</td><td>.CA</td><td>20 min</td><td>ICE Data Services</td></tr><tr><td>Estonia</td><td>Nasdaq OMX Tallinn</td><td>.TL</td><td>Real-time</td><td>ICE Data Services</td></tr><tr><td>Europe</td><td>Cboe Europe</td><td>.XD</td><td>Real-time</td><td>ICE Data Services</td></tr><tr><td>Europe</td><td>Euronext</td><td>.NX</td><td>15 min</td><td>ICE Data Services</td></tr><tr><td>Finland</td><td>Nasdaq OMX Helsinki</td><td>.HE</td><td>Real-time</td><td>ICE Data Services</td></tr><tr><td>France</td><td>Euronext Paris</td><td>.PA</td><td>15 min</td><td>ICE Data Services</td></tr><tr><td>Germany</td><td>Berlin Stock Exchange</td><td>.BE</td><td>15 min</td><td>ICE Data Services</td></tr><tr><td>Germany</td><td>Bremen Stock Exchange</td><td>.BM</td><td>15 min</td><td>ICE Data Services</td></tr><tr><td>Germany</td><td>Dusseldorf Stock Exchange</td><td>.DU</td><td>15 min</td><td>ICE Data Services</td></tr><tr><td>Germany</td><td>Frankfurt Stock Exchange</td><td>.F</td><td>15 min</td><td>ICE Data Services</td></tr><tr><td>Germany</td><td>Hamburg Stock Exchange</td><td>.HM</td><td>15 min</td><td>ICE Data Services</td></tr><tr><td>Germany</td><td>Hanover Stock Exchange</td><td>.HA</td><td>15 min</td><td>ICE Data Services</td></tr><tr><td>Germany</td><td>Munich Stock Exchange</td><td>.MU</td><td>15 min</td><td>ICE Data Services</td></tr><tr><td>Germany</td><td>Stuttgart Stock Exchange</td><td>.SG</td><td>15 min</td><td>ICE Data Services</td></tr><tr><td>Germany</td><td>Deutsche Boerse XETRA</td><td>.DE</td><td>15 min</td><td>ICE Data Services</td></tr><tr><td>Global</td><td>Collectable Indices</td><td>.REGA</td><td>Real-time</td><td>Pricing Culture</td></tr><tr><td>Global</td><td>Cryptocurrencies</td><td>N/A</td><td>Real-time</td><td>CoinMarketCap</td></tr><tr><td>Global</td><td>Currency Rates</td><td>=X</td><td>Real-time</td><td>ICE Data Services</td></tr><tr><td>Global</td><td>MSCI Indices</td><td>N/A</td><td>Real-time</td><td>ICE Data Services</td></tr><tr><td>Greece</td><td>Athens Stock Exchange (ATHEX)</td><td>.AT</td><td>15 min</td><td>ICE Data Services</td></tr><tr><td>Hong Kong</td><td>Hang Seng Indices</td><td>N/A</td><td>15 min</td><td>ICE Data Services</td></tr><tr><td>Hong Kong</td><td>Hong Kong Stock Exchange (HKEX)*</td><td>.HK</td><td>15 min</td><td>ICE Data Services</td></tr><tr><td>Hungary</td><td>Budapest Stock Exchange</td><td>.BD</td><td>15 min</td><td>ICE Data Services</td></tr><tr><td>Iceland</td><td>Nasdaq OMX Iceland</td><td>.IC</td><td>Real-time</td><td>ICE Data Services</td></tr><tr><td>India</td><td>Bombay Stock Exchange</td><td>.BO</td><td>15 min</td><td>ICE Data Services</td></tr><tr><td>India</td><td>National Stock Exchange of India</td><td>.NS</td><td>Real-time</td><td>ICE Data Services</td></tr><tr><td>Indonesia</td><td>Indonesia Stock Exchange (IDX)</td><td>.JK</td><td>10 min</td><td>ICE Data Services</td></tr><tr><td>Ireland</td><td>Euronext Dublin</td><td>.IR</td><td>15 min</td><td>ICE Data Services</td></tr><tr><td>Israel</td><td>Tel Aviv Stock Exchange</td><td>.TA</td><td>20 min</td><td>ICE Data Services</td></tr><tr><td>Italy</td><td>EuroTLX</td><td>.TI</td><td>20 min</td><td>ICE Data Services</td></tr><tr><td>Italy</td><td>Italian Stock Exchange</td><td>.MI</td><td>20 min</td><td>ICE Data Services</td></tr><tr><td>Japan</td><td>Nikkei Indices</td><td>N/A</td><td>30 min</td><td>ICE Data Services</td></tr><tr><td>Japan</td><td>Tokyo Stock Exchange</td><td>.T</td><td>20 min</td><td>ICE Data Services</td></tr><tr><td>Kuwait</td><td>Boursa Kuwait</td><td>.KW</td><td>15 min</td><td>ICE Data Services</td></tr><tr><td>Latvia</td><td>Nasdaq OMX Riga</td><td>.RG</td><td>Real-time</td><td>ICE Data Services</td></tr><tr><td>Lithuania</td><td>Nasdaq OMX Vilnius</td><td>.VS</td><td>Real-time</td><td>ICE Data Services</td></tr><tr><td>Malaysia</td><td>Malaysian Stock Exchange</td><td>.KL</td><td>15 min</td><td>ICE Data Services</td></tr><tr><td>Mexico</td><td>Mexico Stock Exchange (BMV)</td><td>.MX</td><td>20 min</td><td>ICE Data Services</td></tr><tr><td>Netherlands</td><td>Euronext Amsterdam</td><td>.AS</td><td>15 min</td><td>ICE Data Services</td></tr><tr><td>New Zealand</td><td>New Zealand Stock Exchange (NZX)</td><td>.NZ</td><td>20 min</td><td>ICE Data Services</td></tr><tr><td>Norway</td><td>Oslo Stock Exchange</td><td>.OL</td><td>15 min</td><td>ICE Data Services</td></tr><tr><td>Philippines</td><td>Philippine Stock Exchange Indices</td><td>.PS</td><td>15 min</td><td>ICE Data Services</td></tr><tr><td>Poland</td><td>Warsaw Stock Exchange</td><td>.WA</td><td>15 min</td><td>ICE Data Services</td></tr><tr><td>Portugal</td><td>Euronext Lisbon</td><td>.LS</td><td>15 min</td><td>ICE Data Services</td></tr><tr><td>Qatar</td><td>Qatar Stock Exchange</td><td>.QA</td><td>15 min</td><td>ICE Data Services</td></tr><tr><td>Romania</td><td>Bucharest Stock Exchange</td><td>.RO</td><td>15 min</td><td>ICE Data Services</td></tr><tr><td>Singapore</td><td>Singapore Stock Exchange (SGX)</td><td>.SI</td><td>20 min</td><td>ICE Data Services</td></tr><tr><td>South Africa</td><td>Johannesburg Stock Exchange</td><td>.JO</td><td>15 min</td><td>ICE Data Services</td></tr><tr><td>South Korea</td><td>Korea Stock Exchange</td><td>.KS</td><td>20 min</td><td>ICE Data Services</td></tr><tr><td>South Korea</td><td>KOSDAQ</td><td>.KQ</td><td>20 min</td><td>ICE Data Services</td></tr><tr><td>Spain</td><td>Madrid SE C.A.T.S.</td><td>.MC</td><td>15 min</td><td>ICE Data Services</td></tr><tr><td>Saudi Arabia</td><td>Saudi Stock Exchange (Tadawul)</td><td>.SAU</td><td>15 min</td><td>ICE Data Services</td></tr><tr><td>Sweden</td><td>Nasdaq OMX Stockholm</td><td>.ST</td><td>Real-time</td><td>ICE Data Services</td></tr><tr><td>Switzerland</td><td>Swiss Exchange (SIX)</td><td>.SW</td><td>30 min</td><td>ICE Data Services</td></tr><tr><td>Taiwan</td><td>Taiwan OTC Exchange</td><td>.TWO</td><td>20 min</td><td>ICE Data Services</td></tr><tr><td>Taiwan</td><td>Taiwan Stock Exchange (TWSE)</td><td>.TW</td><td>20 min</td><td>ICE Data Services</td></tr><tr><td>Thailand</td><td>Stock Exchange of Thailand (SET)</td><td>.BK</td><td>15 min</td><td>ICE Data Services</td></tr><tr><td>Turkey</td><td>Borsa İstanbul</td><td>.IS</td><td>15 min</td><td>ICE Data Services</td></tr><tr><td>United Arab Emirates</td><td>Dubai Financial Market</td><td>.AE</td><td>15 min</td><td>ICE Data Services</td></tr><tr><td>United Kingdom</td><td>Aquis Exchange AQSE</td><td>.AQ</td><td>15 min</td><td>ICE Data Services</td></tr><tr><td>United Kingdom</td><td>Cboe UK</td><td>.XC</td><td>Real-time</td><td>ICE Data Services</td></tr><tr><td>United Kingdom</td><td>FTSE Indices</td><td>N/A</td><td>15 min</td><td>ICE Data Services</td></tr><tr><td>United Kingdom</td><td>London Stock Exchange</td><td>.L</td><td>20 min</td><td>ICE Data Services</td></tr><tr><td>United Kingdom</td><td>London Stock Exchange</td><td>.IL</td><td>20 min</td><td>ICE Data Services</td></tr><tr><td>Venezuela</td><td>Caracas Stock Exchange</td><td>.CR</td><td>15 min</td><td>ICE Data Services</td></tr><tr><td>Vietnam</td><td>Ho Chi Minh City Stock Exchange</td><td>.VN</td><td>15 min</td><td>ICE Data Services</td></tr></tbody></table>


# Scripts

#### Insert Specified Value into Selected Cells

```javascript
var Numbers = Application ("Numbers");
Numbers.includeStandardAdditions = true;

// get the selected cells
var tables = Numbers.documents[0].activeSheet.tables;
var ranges = tables.selectionRange.name();
for(var tableNum in ranges) {
var thisRange = ranges [tableNum];
if (thisRange != null) break;
}
var range = tables[tableNum].ranges[thisRange];
var cells = range.cells;

// set all cells to the date
for(var i=0;i<cells.length;i++) {
cells [i].value = "smol compute";
}
tables [tableNum].selectionRange = range;
```

Replace "smol compute" with the desired values.&#x20;

```javascript
// get the two tables involved
var Numbers = Application("Numbers");
var database = Numbers. documents [0].sheets [0].tables ['Database'];
var form = Numbers. documents [0].sheets [1].tables ['Data Entry'];

// get all of the values from the form
var values = [];
for(var i=0;i<form. rows. length;i++) {
var value = form. rows [i]. cells [0].value();
values.push (value);
}

//create a new row at the bottom of the database
var newRow = database.cells ['A'+database. rows.length].addRowBelow();

// put the values into that row
for(var i=0;i<values.length;i++) {
newRow.cells[i].value = values[i];
}

// clear out the form, going backwards so to end on the first cell
for(var i=form.rows.length-1;i>=0;i--) {
form.rows[i].cells[0].value = "";
}
```


# Available Currencies

| Currency Code | Currency Name               |
| ------------- | --------------------------- |
| AED           | United Arab Emirates Dirham |
| AUD           | Australian Dollar           |
| BRL           | Brazilian Real              |
| CAD           | Canadian Dollar             |
| CHF           | Swiss Franc                 |
| CNY           | Chinese Yuan                |
| CZK           | Czech Koruna                |
| DKK           | Danish Krone                |
| EGP           | Egyptian Pound              |
| EUR           | Euro                        |
| GBP           | Pound Sterling              |
| HKD           | Hong Kong Dollar            |
| HRK           | Croatian Kuna               |
| HUF           | Hungarian Forint            |
| IDR           | Indonesian Rupiah           |
| ILS           | Israeli New Shekel          |
| INR           | Indian Rupee                |
| JPY           | Japanese Yen                |
| KRW           | Korean Won                  |
| MXN           | Mexican Peso                |
| MYR           | Malaysian Ringgit           |
| NOK           | Norwegian Krone             |
| PLN           | Polish Zloty                |
| RON           | Romanian Leu                |
| RUB           | Russian Ruble               |
| SAR           | Saudi Riyal                 |
| SEK           | Swedish Krona               |
| SGD           | Singapore Dollar            |
| THB           | Thai Baht                   |
| TRY           | Turkish Lira                |
| TWD           | New Taiwan Dollar           |
| USD           | United States Dollar        |
| VND           | Vietnamese Dong             |
| ZAR           | South African Rand          |


# Brand Assets

Smol Compute Brand Assets

## Logo

<figure><img src="/files/p3kjb75agpQmoqsi9Xl9" alt="Smol Compute Logo" width="147"><figcaption><p>Smol Compute Logo</p></figcaption></figure>

## Product Covers

<figure><img src="/files/0TqyQgyOMsE896gVCKA4" alt="Stocks and Crypto Portfolio Tracker for Apple Numbers"><figcaption><p>Smol Portfolio Tracker</p></figcaption></figure>

<figure><img src="/files/vuJZuaw1e0C4suS2FwS7" alt="Stocks and Crypto Investment Tracker for Apple Numbers"><figcaption><p>Smol Portfolio Tracker Lite</p></figcaption></figure>

<figure><img src="/files/KeDHA0BBjOvQ1PylW6fG" alt="Stocks and Crypto Portfolio Tracker for Apple Numbers"><figcaption><p>Smol Formatter</p></figcaption></figure>

<figure><img src="/files/Hid6gg7kxTI2DtHF08Iv" alt="Stocks and Crypto Investment Tracker for Apple Numbers"><figcaption></figcaption></figure>

<figure><img src="/files/yAYOQiIu7Ru0E6Lpmlmm" alt="Stocks and Crypto Portfolio Manager for Apple Numbers"><figcaption><p>square</p></figcaption></figure>

<figure><img src="/files/fMAJevGfntapIFMiquNV" alt="Stocks and Crypto Portfolio Tracker for Apple Numbers"><figcaption></figcaption></figure>

<figure><img src="/files/ePh1Pb5tDeGYz26Bo73Z" alt="Stocks and Crypto Investment Tracker for Apple Numbers"><figcaption><p>square</p></figcaption></figure>

## Screenshots

### Color Themes

<figure><img src="/files/KH7Y741yn2TO8kyssKJX" alt="smol compute Crypto Portfolio Manager for Apple Numbers "><figcaption><p>Color Themes</p></figcaption></figure>

<figure><img src="/files/Grj75BZxYtbfrHLWAAvg" alt="smol compute Crypto Portfolio Manager for Apple Numbers "><figcaption></figcaption></figure>

<figure><img src="/files/7wQgyA7q907kiNdrE5Y0" alt="smol compute Crypto Portfolio Manager for Apple Numbers "><figcaption></figcaption></figure>

<figure><img src="/files/xdsfgq9ox25cAyt9AQpZ" alt="Crypto Tracker Spreadsheet"><figcaption></figcaption></figure>

<figure><img src="/files/E8clP71djuHcbtZW6oJr" alt="Crypto Tracker Spreadsheet"><figcaption></figcaption></figure>

<figure><img src="/files/lLEWCcHIRdiZswgs3ADq" alt="Trading Log for Apple Numbers"><figcaption></figcaption></figure>

<figure><img src="/files/5PxGe4rB9aRPpMmHOqfJ" alt="Trading Journal for Apple Numbers"><figcaption></figcaption></figure>

<figure><img src="/files/mcE5ICLVhwpD9aaztmGN" alt=""><figcaption></figcaption></figure>

<figure><img src="/files/9WUjEPGWovKNvvqFrNsh" alt=""><figcaption></figcaption></figure>

### ROI

<figure><img src="/files/TMsZprpSXirS9rLBBpYi" alt=""><figcaption><p>ROI</p></figcaption></figure>

<figure><img src="/files/SCLfol38tpkSWipyvR09" alt=""><figcaption><p>ROI</p></figcaption></figure>

<figure><img src="/files/vClsR9S5evC3echnQ8Up" alt=""><figcaption></figcaption></figure>

<figure><img src="/files/oq6cgVJU6VYvzb4YrVO2" alt=""><figcaption></figcaption></figure>

<figure><img src="/files/oawQao4w3c53LwSnU4mT" alt=""><figcaption></figcaption></figure>

### Watchlists

<figure><img src="/files/I73GwVQ2Y0toR3C9y6h9" alt=""><figcaption></figcaption></figure>

<figure><img src="/files/wv4dzRGd4CDn4xLpPAL4" alt=""><figcaption></figcaption></figure>

<figure><img src="/files/VlqwITqJLLzTCH376Qqb" alt=""><figcaption></figcaption></figure>

### Accounts

<figure><img src="/files/eTCK2aenLmuFKwzfqNve" alt="Stocks and Crypto Portfolio Tracker for Apple Numbers"><figcaption><p>Account P&#x26;L Chart</p></figcaption></figure>

<figure><img src="/files/3FlIlB64cyNK9IWn934g" alt=""><figcaption></figcaption></figure>

<figure><img src="/files/3rzXVL6cmxiKzFujXKck" alt=""><figcaption><p>Account Holdings</p></figcaption></figure>

<figure><img src="/files/hh6lP2KDFJGEi7osXDfA" alt=""><figcaption><p>Account Trade Log</p></figcaption></figure>

### Dashboard

<figure><img src="/files/IMwZtkwISlBvFGYl9oTQ" alt=""><figcaption></figcaption></figure>

<figure><img src="/files/4r6UuKOdMvMwkxqwBNKc" alt=""><figcaption></figcaption></figure>

<figure><img src="/files/gpGnAwOkCEc7OGFX02tQ" alt=""><figcaption><p>Dashboard with CAD</p></figcaption></figure>

<figure><img src="/files/UzQcBtq0ufD4HmxmSdzo" alt=""><figcaption></figcaption></figure>

<figure><img src="/files/if1VG4xfy0wHkxqKWtNz" alt=""><figcaption><p>Visual P&#x26;L</p></figcaption></figure>

## Themes

<figure><img src="/files/0TqyQgyOMsE896gVCKA4" alt="Stocks and Crypto Portfolio Tracker for MacOS"><figcaption><p>Smol Portfolio Tracker</p></figcaption></figure>

<figure><img src="/files/vuJZuaw1e0C4suS2FwS7" alt="Stocks and Crypto Investment Tracker for MacOS"><figcaption><p>Smol Portfolio Tracker Lite</p></figcaption></figure>

<figure><img src="/files/KeDHA0BBjOvQ1PylW6fG" alt="Stocks and Crypto Portfolio Tracker for Kraken and Binance"><figcaption><p>Smol Formatter</p></figcaption></figure>

<figure><img src="/files/ImSS7EJdkqJWYXQKK2CI" alt="smol compute Portfolio Manager &#x26; Trading Journal for Apple Numbers"><figcaption><p>Color Themes Desktop</p></figcaption></figure>

<figure><img src="/files/xS9VDDn0uDTgpn3KYhH4" alt="smol compute Portfolio Manager &#x26; Trading Journal for Apple Numbers"><figcaption><p>Color Themes Mobile</p></figcaption></figure>

<figure><img src="/files/sKiJHOa2tR5TXLFpPcXh" alt=""><figcaption></figcaption></figure>

<figure><img src="/files/9WN1P8otvSA93jr9nV97" alt=""><figcaption></figcaption></figure>

<figure><img src="/files/mpaeV0glcSCrB2hCw1DY" alt=""><figcaption></figcaption></figure>

## Details

<figure><img src="/files/d5G2lrH69kJW5iQMWMB1" alt=""><figcaption><p>Dashboard - Details - Currency</p></figcaption></figure>

<figure><img src="/files/FecjJbZglg4DqJjvX20s" alt=""><figcaption></figcaption></figure>

<figure><img src="/files/uoeDgECy1Bw0eTJLei3y" alt="Track Blockchain Network Fees"><figcaption></figcaption></figure>

1

## Deprecated Themes

### The FT&#x20;

<figure><img src="/files/j7lplcWHnH19rnfkX7Tg" alt=""><figcaption></figcaption></figure>

<figure><img src="/files/xw7mXOeQcOuB8TSOZaN6" alt=""><figcaption></figcaption></figure>

<figure><img src="/files/BhJMrYrdGoDpphz5ydzt" alt=""><figcaption></figcaption></figure>

<figure><img src="/files/NEGpfTXkXGL0tVXDBu6Q" alt=""><figcaption></figcaption></figure>

<figure><img src="/files/nFqCYufc72wAElrn8lox" alt=""><figcaption></figcaption></figure>

### Dracula

<figure><img src="/files/tus01v8fUigKTxVPvRKg" alt="Crypto Portfolio Manager Spreadsheet"><figcaption></figcaption></figure>

<figure><img src="/files/WJmgHYt83k1mkKrzkPtr" alt="Crypto Portfolio Tracker Spreadsheet"><figcaption></figcaption></figure>

<figure><img src="/files/v8yq9SgH2WQqeXMROrsD" alt=""><figcaption></figcaption></figure>

<figure><img src="/files/7BSsHEjbi7oN8r8HymQY" alt=""><figcaption></figcaption></figure>

<figure><img src="/files/9YLTNpPaYcLtHKJn928b" alt=""><figcaption></figcaption></figure>

### smol Terminal

<figure><img src="/files/CyHFvaMvdpXXtN0bPStr" alt=""><figcaption></figcaption></figure>

<figure><img src="/files/ex1dcQ5xqkKQBM1fYB02" alt=""><figcaption></figcaption></figure>

<figure><img src="/files/Z8sQRkBbjN1eTSHEflVU" alt=""><figcaption></figcaption></figure>

<figure><img src="/files/PzAUkdRDq2eVuCXpubzn" alt=""><figcaption></figcaption></figure>

<figure><img src="/files/VVinV2NUMJxypUarxpFR" alt=""><figcaption></figcaption></figure>

### Bloomberg Terminal

<figure><img src="/files/L98v2oZUCumsLRN5Qufg" alt=""><figcaption></figcaption></figure>

<figure><img src="/files/H1I3et5tzjy6a7EVWGn8" alt=""><figcaption></figcaption></figure>

<figure><img src="/files/NF701tjQeicQ5Ty2UNTk" alt=""><figcaption></figcaption></figure>

<figure><img src="/files/nULc1COyderQFmml4YYP" alt=""><figcaption></figcaption></figure>

<figure><img src="/files/SeSi9cDOCZrqtadxQJxn" alt=""><figcaption></figcaption></figure>

If you decide to change color theme after having set up your Portfolio Tracker, simply[ paste your data](/1/how-to/data-migration) in the chosen template.&#x20;